Wells Fargo 2013 Annual Report Download - page 105
Download and view the complete annual report
Please find page 105 of the 2013 Wells Fargo annual report below. You can navigate through the pages in the report by either clicking on the pages listed below, or by using the keyword search tool below to find specific information within the annual report.-
 1
1 -
2
-
3
-
4
-
5
-
6
-
7
-
8
-
9
-
10
-
11
-
12
-
13
-
14
-
15
-
16
-
17
-
18
-
19
-
20
-
21
-
22
-
23
-
24
-
25
-
26
-
27
-
28
-
29
-
30
-
31
-
32
-
33
-
34
-
35
-
36
-
37
-
38
-
39
-
40
-
41
-
42
-
43
-
44
-
45
-
46
-
47
-
48
-
49
-
50
-
51
-
52
-
53
-
54
-
55
-
56
-
57
-
58
-
59
-
60
-
61
-
62
-
63
-
64
-
65
-
66
-
67
-
68
-
69
-
70
-
71
-
72
-
73
-
74
-
75
-
76
-
77
-
78
-
79
-
80
-
81
-
82
-
83
-
84
-
85
-
86
-
87
-
88
-
89
-
90
-
91
-
92
-
93
-
94
-
 95
95 -
 96
96 -
 97
97 -
 98
98 -
 99
99 -
 100
100 -
 101
101 -
 102
102 -
 103
103 -
 104
104 -
 105
105 -
 106
106 -
 107
107 -
 108
108 -
 109
109 -
 110
110 -
 111
111 -
 112
112 -
 113
113 -
 114
114 -
 115
115 -
116
-
117
-
118
-
119
-
120
-
121
-
122
-
123
-
124
-
125
-
126
-
127
-
128
-
129
-
130
-
131
-
132
-
133
-
134
-
135
-
136
-
137
-
138
-
139
-
140
-
141
-
142
-
143
-
144
-
145
-
146
-
147
-
148
-
149
-
150
-
151
-
152
-
153
-
154
-
155
-
156
-
157
-
158
-
159
-
160
-
161
-
162
-
163
-
164
-
165
-
166
-
167
-
168
-
169
-
170
-
171
-
172
-
173
-
174
-
175
-
176
-
177
-
178
-
179
-
180
-
181
-
182
-
183
-
184
-
185
-
186
-
187
-
188
-
189
-
190
-
191
-
192
-
193
-
194
-
195
-
196
-
197
-
198
-
199
-
200
-
201
-
202
-
203
-
204
-
205
-
206
-
207
-
208
-
209
-
210
-
211
-
212
-
213
-
214
-
215
-
216
-
217
-
218
-
219
-
220
-
221
-
222
-
223
-
224
-
225
-
226
-
227
-
228
-
229
-
230
-
231
-
232
-
233
-
234
-
235
-
236
-
237
-
238
-
239
-
240
-
241
-
242
-
243
-
244
-
245
-
246
-
247
-
248
-
249
-
250
-
251
-
252
-
253
-
254
-
255
-
256
-
257
-
258
-
259
-
260
-
261
-
262
-
263
-
264
-
265
-
266
-
267
-
268
-
269
-
270
-
271
-
272
 |
 |
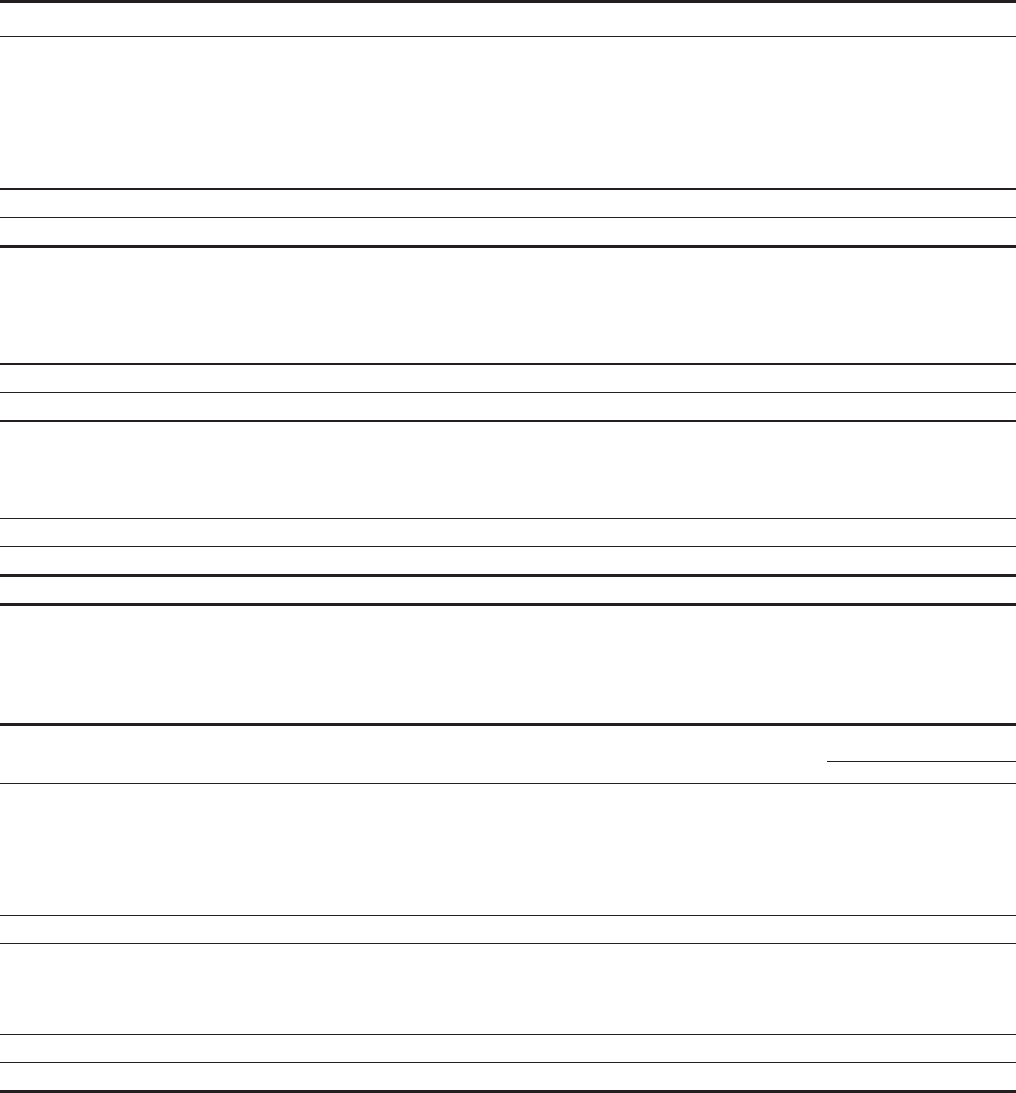
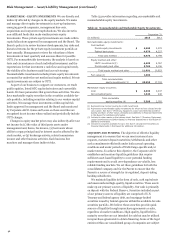
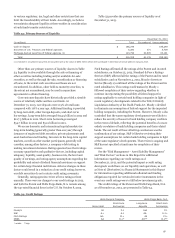
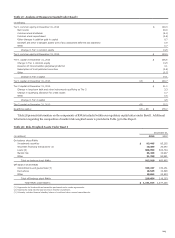
Table 57: Analysis of Changes in Capital Under Basel I
(in billions)
Tier 1 common equity at December 31, 2012 $ 109.0
Net income 20.9
Common stock dividends (6.1)
Common stock repurchased (2.6)
Other changes in addition paid in capital 0.7
Goodwill and other intangible assets (net of any associated deferred tax liabilities) 0.9
Other 0.7
Change in Tier 1 common equity 14.5
Tier 1 common equity at December 31, 2013 $ 123.5
Tier 1 capital at December 31, 2012 $ 126.6
Change in Tier 1 common equity 14.5
Issuance of noncumulative perpetual preferred 3.1
Redemption of trust preferred securities (2.8)
Other (0.7)
Change in Tier 1 capital 14.1
Tier 1 capital at December 31, 2013 (A) $ 140.7
Tier 2 capital at December 31, 2012 $ 31.0
Change in long-term debt and other instruments qualifying as Tier 2 3.3
Change in qualifying allowance for credit losses 0.7
Other 0.5
Change in Tier 2 capital 4.5
Tier 2 capital at December 31, 2013 (B) 35.5
Qualifying capital (A) + (B) $ 176.2
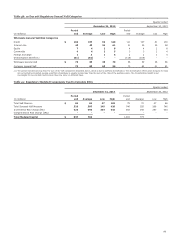
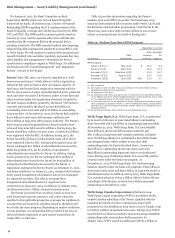
Table 58 presents information on the components of RWAs included within our regulatory capital ratios under Basel I. Additional
information regarding the composition of market risk-weighted assets is provided in Table 59 in this Report.
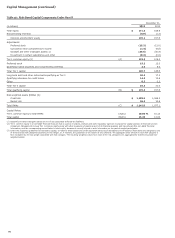
Table 58: Risk-Weighted Assets Under Basel I
December 31,
(in millions) 2013 2012
On-balance sheet RWAs
Investment securities $ 93,445 85,205
Securities financing transactions (1) 10,385 20,040
Loans (2) 680,953 660,724
Market risk 36,339 10,947
Other 91,788 83,981
Total on-balance sheet RWAs 912,910 860,897
Off-balance sheet RWAs
Commitments and guarantees (3) 199,197 180,151
Derivatives 10,545 13,599
Other 18,862 22,503
Total off-balance sheet RWAs 228,604 216,253
Total RWAs under Basel I $ 1,141,514 1,077,150
(1) Represents fed funds sold and securities purchased under resale agreements.
(2) Represents loans held for sale and loans held for investment.
(3) Primarily includes financial standby letters of credit and other unused commitments.
103