Wells Fargo 2013 Annual Report Download - page 157
Download and view the complete annual report
Please find page 157 of the 2013 Wells Fargo annual report below. You can navigate through the pages in the report by either clicking on the pages listed below, or by using the keyword search tool below to find specific information within the annual report.-
 1
1 -
2
-
3
-
4
-
5
-
6
-
7
-
8
-
9
-
10
-
11
-
12
-
13
-
14
-
15
-
16
-
17
-
18
-
19
-
20
-
21
-
22
-
23
-
24
-
25
-
26
-
27
-
28
-
29
-
30
-
31
-
32
-
33
-
34
-
35
-
36
-
37
-
38
-
39
-
40
-
41
-
42
-
43
-
44
-
45
-
46
-
47
-
48
-
49
-
50
-
51
-
52
-
53
-
54
-
55
-
56
-
57
-
58
-
59
-
60
-
61
-
62
-
63
-
64
-
65
-
66
-
67
-
68
-
69
-
70
-
71
-
72
-
73
-
74
-
75
-
76
-
77
-
78
-
79
-
80
-
81
-
82
-
83
-
84
-
85
-
86
-
87
-
88
-
89
-
90
-
91
-
92
-
93
-
94
-
95
-
96
-
97
-
98
-
99
-
100
-
101
-
102
-
103
-
104
-
105
-
106
-
107
-
108
-
109
-
110
-
111
-
112
-
113
-
114
-
115
-
116
-
117
-
118
-
119
-
120
-
121
-
122
-
123
-
124
-
125
-
126
-
127
-
128
-
129
-
130
-
131
-
132
-
133
-
134
-
135
-
136
-
137
-
138
-
139
-
140
-
141
-
142
-
143
-
144
-
145
-
146
-
 147
147 -
 148
148 -
 149
149 -
 150
150 -
 151
151 -
 152
152 -
 153
153 -
 154
154 -
 155
155 -
 156
156 -
 157
157 -
 158
158 -
 159
159 -
 160
160 -
 161
161 -
 162
162 -
 163
163 -
 164
164 -
 165
165 -
 166
166 -
 167
167 -
168
-
169
-
170
-
171
-
172
-
173
-
174
-
175
-
176
-
177
-
178
-
179
-
180
-
181
-
182
-
183
-
184
-
185
-
186
-
187
-
188
-
189
-
190
-
191
-
192
-
193
-
194
-
195
-
196
-
197
-
198
-
199
-
200
-
201
-
202
-
203
-
204
-
205
-
206
-
207
-
208
-
209
-
210
-
211
-
212
-
213
-
214
-
215
-
216
-
217
-
218
-
219
-
220
-
221
-
222
-
223
-
224
-
225
-
226
-
227
-
228
-
229
-
230
-
231
-
232
-
233
-
234
-
235
-
236
-
237
-
238
-
239
-
240
-
241
-
242
-
243
-
244
-
245
-
246
-
247
-
248
-
249
-
250
-
251
-
252
-
253
-
254
-
255
-
256
-
257
-
258
-
259
-
260
-
261
-
262
-
263
-
264
-
265
-
266
-
267
-
268
-
269
-
270
-
271
-
272
 |
 |

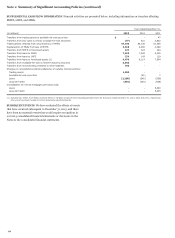
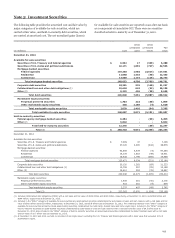
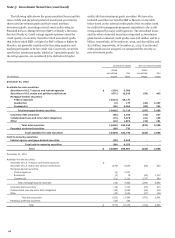
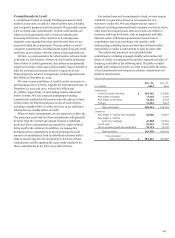
Note 5: Investment Securities
The following table provides the amortized cost and fair value by
major categories of available-for-sale securities, which are
carried at fair value, and held-to-maturity debt securities, which
are carried at amortized cost. The net unrealized gains (losses)
for available-for-sale securities are reported on an after-tax basis
as a component of cumulative OCI. There were no securities
classified as held-to-maturity as of December 31, 2012.
(in millions) Cost
Gross
unrealized
gains
Gross
unrealized
losses
Fair
value
December 31, 2013
Available-for-sale securities:
Securities of U.S. Treasury and federal agencies $ 6,592 17 (329) 6,280
Securities of U.S. states and political subdivisions 42,171 1,092 (727) 42,536
Mortgage-backed securities:
Federal agencies 119,303 1,902 (3,614) 117,591
Residential 11,060 1,433 (40) 12,453
Commercial 17,689 1,173 (115) 18,747
Total mortgage-backed securities 148,052 4,508 (3,769) 148,791
Corporate debt securities 20,391 976 (140) 21,227
Collateralized loan and other debt obligations (1) 19,610 642 (93) 20,159
Other (2) 9,232 426 (29) 9,629
Total debt securities 246,048 7,661 (5,087) 248,622
Marketable equity securities:
Perpetual preferred securities 1,703 222 (60) 1,865
Other marketable equity securities 336 1,188 (4) 1,520
Total marketable equity securities 2,039 1,410 (64) 3,385
Total available-for-sale securities 248,087 9,071 (5,151) 252,007
Held-to-maturity securities:
Federal agency mortgage-backed securities 6,304 - (99) 6,205
Other (2) 6,042 - - 6,042
Total held-to-maturity securities 12,346 - (99) 12,247
Total (3) $ 260,433 9,071 (5,250) 264,254
December 31, 2012
Available-for-sale securities:
Securities of U.S. Treasury and federal agencies $ 7,099 47 - 7,146
Securities of U.S. states and political subdivisions 37,120 2,000 (444) 38,676
Mortgage-backed securities:
Federal agencies 92,855 4,434 (4) 97,285
Residential 14,178 1,802 (49) 15,931
Commercial 18,438 1,798 (268) 19,968
Total mortgage-backed securities 125,471 8,034 (321) 133,184
Corporate debt securities 20,120 1,282 (69) 21,333
Collateralized loan and other debt obligations (1) 12,726 557 (95) 13,188
Other (2) 18,410 553 (76) 18,887
Total debt securities 220,946 12,473 (1,005) 232,414
Marketable equity securities:
Perpetual preferred securities 1,935 281 (40) 2,176
Other marketable equity securities 402 216 (9) 609
Total marketable equity securities 2,337 497 (49) 2,785
Total (3) $ 223,283 12,970 (1,054) 235,199
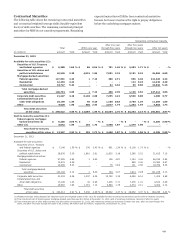
(1) Includes collateralized debt obligations (CDOs) with a cost basis and fair value of $509 million and $693 million, respectively, at December 31, 2013, and $556 million and
$644 million, respectively at December 31, 2012.
(2) Included in the “Other” category of available-for-sale securities are asset-backed securities collateralized by auto leases or loans and cash reserves with a cost basis and fair
value of $500 million and $513 million, respectively, at December 31, 2013, and $5.9 billion each at December 31, 2012. The remaining balances in the “Other” category of
available-for-sale securities primarily include asset-backed securities collateralized by credit cards, student loans and home equity loans. Included in the “Other” category of
held-to-maturity securities are asset-backed securities collateralized by auto leases or loans and cash reserves with a cost basis and fair value of $4.3 billion each at
December 31, 2013. Also included in the “Other” category of held-to-maturity securities are asset-backed securities collateralized by dealer floorplan loans with a cost basis
and fair value of $1.7 billion each at December 31, 2013.
(3) At December 31, 2013 and 2012, we held no securities of any single issuer (excluding the U.S. Treasury and federal agencies) with a book value that exceeded 10% of
stockholders’ equity.
155