Wells Fargo 2013 Annual Report Download - page 36
Download and view the complete annual report
Please find page 36 of the 2013 Wells Fargo annual report below. You can navigate through the pages in the report by either clicking on the pages listed below, or by using the keyword search tool below to find specific information within the annual report.-
 1
1 -
2
-
3
-
4
-
5
-
6
-
7
-
8
-
9
-
10
-
11
-
12
-
13
-
14
-
15
-
16
-
17
-
18
-
19
-
20
-
21
-
22
-
23
-
24
-
25
-
 26
26 -
 27
27 -
 28
28 -
 29
29 -
 30
30 -
 31
31 -
 32
32 -
 33
33 -
 34
34 -
 35
35 -
 36
36 -
 37
37 -
 38
38 -
 39
39 -
 40
40 -
 41
41 -
 42
42 -
 43
43 -
 44
44 -
 45
45 -
 46
46 -
47
-
48
-
49
-
50
-
51
-
52
-
53
-
54
-
55
-
56
-
57
-
58
-
59
-
60
-
61
-
62
-
63
-
64
-
65
-
66
-
67
-
68
-
69
-
70
-
71
-
72
-
73
-
74
-
75
-
76
-
77
-
78
-
79
-
80
-
81
-
82
-
83
-
84
-
85
-
86
-
87
-
88
-
89
-
90
-
91
-
92
-
93
-
94
-
95
-
96
-
97
-
98
-
99
-
100
-
101
-
102
-
103
-
104
-
105
-
106
-
107
-
108
-
109
-
110
-
111
-
112
-
113
-
114
-
115
-
116
-
117
-
118
-
119
-
120
-
121
-
122
-
123
-
124
-
125
-
126
-
127
-
128
-
129
-
130
-
131
-
132
-
133
-
134
-
135
-
136
-
137
-
138
-
139
-
140
-
141
-
142
-
143
-
144
-
145
-
146
-
147
-
148
-
149
-
150
-
151
-
152
-
153
-
154
-
155
-
156
-
157
-
158
-
159
-
160
-
161
-
162
-
163
-
164
-
165
-
166
-
167
-
168
-
169
-
170
-
171
-
172
-
173
-
174
-
175
-
176
-
177
-
178
-
179
-
180
-
181
-
182
-
183
-
184
-
185
-
186
-
187
-
188
-
189
-
190
-
191
-
192
-
193
-
194
-
195
-
196
-
197
-
198
-
199
-
200
-
201
-
202
-
203
-
204
-
205
-
206
-
207
-
208
-
209
-
210
-
211
-
212
-
213
-
214
-
215
-
216
-
217
-
218
-
219
-
220
-
221
-
222
-
223
-
224
-
225
-
226
-
227
-
228
-
229
-
230
-
231
-
232
-
233
-
234
-
235
-
236
-
237
-
238
-
239
-
240
-
241
-
242
-
243
-
244
-
245
-
246
-
247
-
248
-
249
-
250
-
251
-
252
-
253
-
254
-
255
-
256
-
257
-
258
-
259
-
260
-
261
-
262
-
263
-
264
-
265
-
266
-
267
-
268
-
269
-
270
-
271
-
272
 |
 |

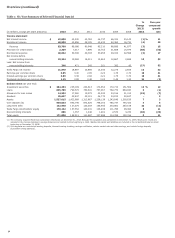
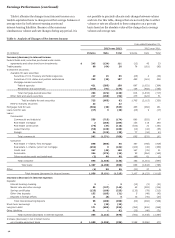
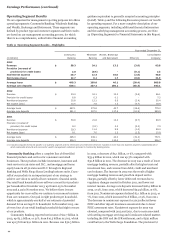
Earnings Performance
Wells Fargo net income for 2013 was $21.9 billion ($3.89 diluted
earnings per common share), compared with $18.9 billion
($3.36 diluted per share) for 2012 and $15.9 billion
($2.82 diluted per share) for 2011. Our 2013 earnings reflected
strong execution of our business strategy as well as growth in
many of our businesses. Our financial performance in 2013 was
significantly affected by a reduced provision for credit losses,
reflecting strong underlying credit performance. We also
generated diversified sources of fee income across many of our
businesses and grew loans and deposits.
Revenue, the sum of net interest income and noninterest
income, was $83.8 billion in 2013, compared with $86.1 billion
in 2012 and $80.9 billion in 2011. The decrease in revenue for
2013 was predominantly due to a decrease in noninterest
income, reflecting declines in mortgage banking origination
volume as interest rates rose during 2013. In 2013, net interest
income of $42.8 billion represented 51% of revenue, compared
with $43.2 billion (50%) in 2012 and $42.8 billion (53%) in
2011.
Noninterest income was $41.0 billion in 2013, representing
49% of revenue, compared with $42.9 billion (50%) in 2012 and
$38.2 billion (47%) in 2011. The decrease in 2013 was driven
predominantly by a 25% decline in mortgage banking income
due to decreased net gains on mortgage loan origination/sales
activities, offset by higher servicing income. Mortgage loan
originations were $351 billion in 2013, down from $524 billion a
year ago.
Noninterest expense was $48.8 billion in 2013, compared
with $50.4 billion in 2012 and $49.4 billion in 2011. Noninterest
expense as a percentage of revenue (efficiency ratio) was 58.3%
in 2013, 58.5% in 2012 and 61.0% in 2011, reflecting our expense
management efforts. The decrease in 2013 compared with 2012
reflected lower operating losses, lower foreclosed assets expense,
and lower FDIC and other deposit assessments.
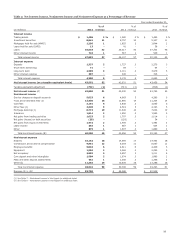
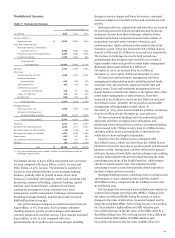
Table 3 presents the components of revenue and noninterest
expense as a percentage of revenue for year-over-year results.
34