Wells Fargo 2013 Annual Report Download - page 199
Download and view the complete annual report
Please find page 199 of the 2013 Wells Fargo annual report below. You can navigate through the pages in the report by either clicking on the pages listed below, or by using the keyword search tool below to find specific information within the annual report.-
 1
1 -
2
-
3
-
4
-
5
-
6
-
7
-
8
-
9
-
10
-
11
-
12
-
13
-
14
-
15
-
16
-
17
-
18
-
19
-
20
-
21
-
22
-
23
-
24
-
25
-
26
-
27
-
28
-
29
-
30
-
31
-
32
-
33
-
34
-
35
-
36
-
37
-
38
-
39
-
40
-
41
-
42
-
43
-
44
-
45
-
46
-
47
-
48
-
49
-
50
-
51
-
52
-
53
-
54
-
55
-
56
-
57
-
58
-
59
-
60
-
61
-
62
-
63
-
64
-
65
-
66
-
67
-
68
-
69
-
70
-
71
-
72
-
73
-
74
-
75
-
76
-
77
-
78
-
79
-
80
-
81
-
82
-
83
-
84
-
85
-
86
-
87
-
88
-
89
-
90
-
91
-
92
-
93
-
94
-
95
-
96
-
97
-
98
-
99
-
100
-
101
-
102
-
103
-
104
-
105
-
106
-
107
-
108
-
109
-
110
-
111
-
112
-
113
-
114
-
115
-
116
-
117
-
118
-
119
-
120
-
121
-
122
-
123
-
124
-
125
-
126
-
127
-
128
-
129
-
130
-
131
-
132
-
133
-
134
-
135
-
136
-
137
-
138
-
139
-
140
-
141
-
142
-
143
-
144
-
145
-
146
-
147
-
148
-
149
-
150
-
151
-
152
-
153
-
154
-
155
-
156
-
157
-
158
-
159
-
160
-
161
-
162
-
163
-
164
-
165
-
166
-
167
-
168
-
169
-
170
-
171
-
172
-
173
-
174
-
175
-
176
-
177
-
178
-
179
-
180
-
181
-
182
-
183
-
184
-
185
-
186
-
187
-
188
-
 189
189 -
 190
190 -
 191
191 -
 192
192 -
 193
193 -
 194
194 -
 195
195 -
 196
196 -
 197
197 -
 198
198 -
 199
199 -
 200
200 -
 201
201 -
 202
202 -
 203
203 -
 204
204 -
 205
205 -
 206
206 -
 207
207 -
 208
208 -
 209
209 -
210
-
211
-
212
-
213
-
214
-
215
-
216
-
217
-
218
-
219
-
220
-
221
-
222
-
223
-
224
-
225
-
226
-
227
-
228
-
229
-
230
-
231
-
232
-
233
-
234
-
235
-
236
-
237
-
238
-
239
-
240
-
241
-
242
-
243
-
244
-
245
-
246
-
247
-
248
-
249
-
250
-
251
-
252
-
253
-
254
-
255
-
256
-
257
-
258
-
259
-
260
-
261
-
262
-
263
-
264
-
265
-
266
-
267
-
268
-
269
-
270
-
271
-
272
 |
 |

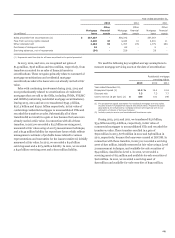
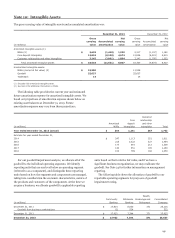
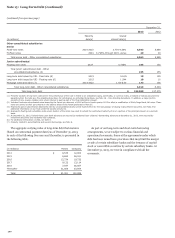
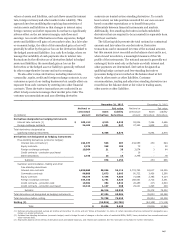
Note 10: Intangible Assets
The gross carrying value of intangible assets and accumulated amortization was:
December 31, 2013 December 31, 2012
(in millions)
Gross
carrying
value
Accumulated
amortization
Net
carrying
value
Gross
carrying
value
Accumulated
amortization
Net
carrying
value
Amortized intangible assets (1):
MSRs (2) $ 2,639 (1,410) 1,229 2,317 (1,157) 1,160
Core deposit intangibles 12,834 (8,160) 4,674 12,836 (6,921) 5,915
Customer relationship and other intangibles 3,145 (2,061) 1,084 3,147 (1,795) 1,352
Total amortized intangible assets $ 18,618 (11,631) 6,987 18,300 (9,873) 8,427
Unamortized intangible assets:
MSRs (carried at fair value) (2) $ 15,580 11,538
Goodwill 25,637 25,637
Trademark 14 14
(1) Excludes fully amortized intangible assets.
(2) See Note 9 for additional information on MSRs.
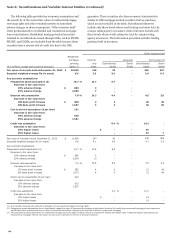
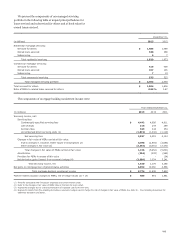
The following table provides the current year and estimated
future amortization expense for amortized intangible assets. We
based our projections of amortization expense shown below on
existing asset balances at December 31, 2013. Future
amortization expense may vary from these projections.
(in millions)
Amortized
MSRs
Core
deposit
intangibles
Customer
relationship
and other
intangibles Total
Year ended December 31, 2013 (actual) $ 254 1,241 267 1,762
Estimate for year ended December 31,
2014 $ 247 1,113 251 1,611
2015 215 1,022 227 1,464
2016 177 919 212 1,308
2017 134 851 195 1,180
2018 100 769 184 1,053
For our goodwill impairment analysis, we allocate all of the
goodwill to the individual operating segments. We identify
reporting units that are one level below an operating segment
(referred to as a component), and distinguish these reporting
units based on how the segments and components are managed,
taking into consideration the economic characteristics, nature of
the products and customers of the components. At the time we
acquire a business, we allocate goodwill to applicable reporting
units based on their relative fair value, and if we have a
significant business reorganization, we may reallocate the
goodwill. See Note 24 for further information on management
reporting.
The following table shows the allocation of goodwill to our
reportable operating segments for purposes of goodwill
impairment testing.
(in millions)
Community
Banking
Wholesal
Banking
Wealth,
e Brokerage and
Retirement
Consolidated
Company
December 31, 2011 $ 17,924 6,820 371 25,115
Goodwill from business combinations (2) 524 - 522
December 31, 2012 $ 17,922 7,344 371 25,637
December 31, 2013 $ 17,922 7,344 371 25,637
197