Wells Fargo 2013 Annual Report Download - page 135
Download and view the complete annual report
Please find page 135 of the 2013 Wells Fargo annual report below. You can navigate through the pages in the report by either clicking on the pages listed below, or by using the keyword search tool below to find specific information within the annual report.-
 1
1 -
2
-
3
-
4
-
5
-
6
-
7
-
8
-
9
-
10
-
11
-
12
-
13
-
14
-
15
-
16
-
17
-
18
-
19
-
20
-
21
-
22
-
23
-
24
-
25
-
26
-
27
-
28
-
29
-
30
-
31
-
32
-
33
-
34
-
35
-
36
-
37
-
38
-
39
-
40
-
41
-
42
-
43
-
44
-
45
-
46
-
47
-
48
-
49
-
50
-
51
-
52
-
53
-
54
-
55
-
56
-
57
-
58
-
59
-
60
-
61
-
62
-
63
-
64
-
65
-
66
-
67
-
68
-
69
-
70
-
71
-
72
-
73
-
74
-
75
-
76
-
77
-
78
-
79
-
80
-
81
-
82
-
83
-
84
-
85
-
86
-
87
-
88
-
89
-
90
-
91
-
92
-
93
-
94
-
95
-
96
-
97
-
98
-
99
-
100
-
101
-
102
-
103
-
104
-
105
-
106
-
107
-
108
-
109
-
110
-
111
-
112
-
113
-
114
-
115
-
116
-
117
-
118
-
119
-
120
-
121
-
122
-
123
-
124
-
 125
125 -
 126
126 -
 127
127 -
 128
128 -
 129
129 -
 130
130 -
 131
131 -
 132
132 -
 133
133 -
 134
134 -
 135
135 -
 136
136 -
 137
137 -
 138
138 -
 139
139 -
 140
140 -
 141
141 -
 142
142 -
 143
143 -
 144
144 -
 145
145 -
146
-
147
-
148
-
149
-
150
-
151
-
152
-
153
-
154
-
155
-
156
-
157
-
158
-
159
-
160
-
161
-
162
-
163
-
164
-
165
-
166
-
167
-
168
-
169
-
170
-
171
-
172
-
173
-
174
-
175
-
176
-
177
-
178
-
179
-
180
-
181
-
182
-
183
-
184
-
185
-
186
-
187
-
188
-
189
-
190
-
191
-
192
-
193
-
194
-
195
-
196
-
197
-
198
-
199
-
200
-
201
-
202
-
203
-
204
-
205
-
206
-
207
-
208
-
209
-
210
-
211
-
212
-
213
-
214
-
215
-
216
-
217
-
218
-
219
-
220
-
221
-
222
-
223
-
224
-
225
-
226
-
227
-
228
-
229
-
230
-
231
-
232
-
233
-
234
-
235
-
236
-
237
-
238
-
239
-
240
-
241
-
242
-
243
-
244
-
245
-
246
-
247
-
248
-
249
-
250
-
251
-
252
-
253
-
254
-
255
-
256
-
257
-
258
-
259
-
260
-
261
-
262
-
263
-
264
-
265
-
266
-
267
-
268
-
269
-
270
-
271
-
272
 |
 |

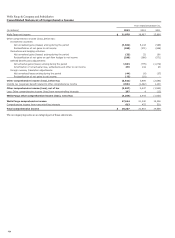
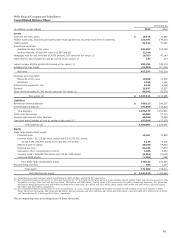
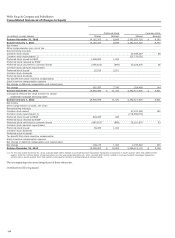
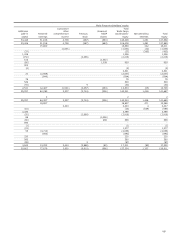
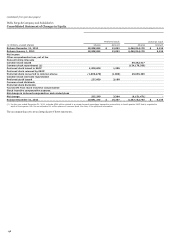
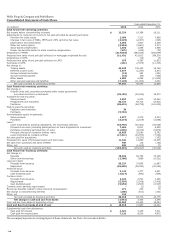
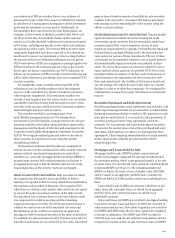
Wells Fargo & Company and Subsidiaries
Consolidated Statement of Income
Year ended December 31,
(in millions, except per share amounts) 2013 2012 2011
Interest income
Trading assets
Investment securities
$ 1,376
8,116
1,358
8,098
1,440
8,475
Mortgages held for sale 1,290 1,825 1,644
Loans held for sale
Loans
13
35,571
41
36,482
58
37,247
Other interest income 723 587 548
Total interest income 47,089 48,391 49,412
Interest expense
Deposits
Short-term borrowings
1,337
60
1,727
79
2,275
80
Long-term debt 2,585 3,110 3,978
Other interest expense 307 245 316
Total interest expense 4,289 5,161 6,649
Net interest income 42,800 43,230 42,763
Provision for credit losses 2,309 7,217 7,899
Net interest income after provision for credit losses 40,491 36,013 34,864
Noninterest income
Service charges on deposit accounts
Trust and investment fees
5,023
13,430
4,683
11,890
4,280
11,304
Card fees 3,191 2,838 3,653
Other fees
Mortgage banking
4,340
8,774
4,519
11,638
4,193
7,832
Insurance 1,814 1,850 1,960
Net gains from trading activities
Net gains (losses) on debt securities (1)
1,623
(29)
1,707
(128)
1,014
54
Net gains from equity investments (2)
Lease income
1,472
663
1,485
567
1,482
524
Other 679 1,807 1,889
Total noninterest income 40,980 42,856 38,185
Noninterest expense
Salaries 15,152 14,689 14,462
Commission and incentive compensation
Employee benefits
9,951
5,033
9,504
4,611
8,857
4,348
Equipment 1,984 2,068 2,283
Net occupancy
Core deposit and other intangibles
2,895
1,504
2,857
1,674
3,011
1,880
FDIC and other deposit assessments 961 1,356 1,266
Other 11,362 13,639 13,286
Total noninterest expense 48,842 50,398 49,393
Income before income tax expense 32,629 28,471 23,656
Income tax expense 10,405 9,103 7,445
Net income before noncontrolling interests
Less: Net income from noncontrolling interests
22,224
346
19,368
471
16,211
342
Wells Fargo net income $ 21,878 18,897 15,869
Less: Preferred stock dividends and other 989 898 844
Wells Fargo net income applicable to common stock $ 20,889 17,999 15,025
Per share information
Earnings per common share $ 3.95 3.40 2.85
Diluted earnings per common share
Dividends declared per common share
3.89
1.15
3.36
0.88
2.82
0.48
Average common shares outstanding
Diluted average common shares outstanding
5,287.3
5,371.2
5,287.6
5,351.5
5,278.1
5,323.4
(1) Total other-than-temporary impairment (OTTI) losses (gains) were $39 million, $3 million and $349 million for the year ended December 31, 2013, 2012 and 2011,
respectively. Of total OTTI, losses of $158 million, $240 million and $423 million were recognized in earnings, and gains of $(119) million, $(237) million and $(74) million
were recognized as non-credit-related OTTI in other comprehensive income for the year ended December 31, 2013, 2012 and 2011, respectively.
(2) Includes OTTI losses of $186 million, $176 million and $288 million for the year ended December 31, 2013, 2012 and 2011, respectively.
The accompanying notes are an integral part of these statements.
133