Wells Fargo 2013 Annual Report Download - page 224
Download and view the complete annual report
Please find page 224 of the 2013 Wells Fargo annual report below. You can navigate through the pages in the report by either clicking on the pages listed below, or by using the keyword search tool below to find specific information within the annual report.-
 1
1 -
2
-
3
-
4
-
5
-
6
-
7
-
8
-
9
-
10
-
11
-
12
-
13
-
14
-
15
-
16
-
17
-
18
-
19
-
20
-
21
-
22
-
23
-
24
-
25
-
26
-
27
-
28
-
29
-
30
-
31
-
32
-
33
-
34
-
35
-
36
-
37
-
38
-
39
-
40
-
41
-
42
-
43
-
44
-
45
-
46
-
47
-
48
-
49
-
50
-
51
-
52
-
53
-
54
-
55
-
56
-
57
-
58
-
59
-
60
-
61
-
62
-
63
-
64
-
65
-
66
-
67
-
68
-
69
-
70
-
71
-
72
-
73
-
74
-
75
-
76
-
77
-
78
-
79
-
80
-
81
-
82
-
83
-
84
-
85
-
86
-
87
-
88
-
89
-
90
-
91
-
92
-
93
-
94
-
95
-
96
-
97
-
98
-
99
-
100
-
101
-
102
-
103
-
104
-
105
-
106
-
107
-
108
-
109
-
110
-
111
-
112
-
113
-
114
-
115
-
116
-
117
-
118
-
119
-
120
-
121
-
122
-
123
-
124
-
125
-
126
-
127
-
128
-
129
-
130
-
131
-
132
-
133
-
134
-
135
-
136
-
137
-
138
-
139
-
140
-
141
-
142
-
143
-
144
-
145
-
146
-
147
-
148
-
149
-
150
-
151
-
152
-
153
-
154
-
155
-
156
-
157
-
158
-
159
-
160
-
161
-
162
-
163
-
164
-
165
-
166
-
167
-
168
-
169
-
170
-
171
-
172
-
173
-
174
-
175
-
176
-
177
-
178
-
179
-
180
-
181
-
182
-
183
-
184
-
185
-
186
-
187
-
188
-
189
-
190
-
191
-
192
-
193
-
194
-
195
-
196
-
197
-
198
-
199
-
200
-
201
-
202
-
203
-
204
-
205
-
206
-
207
-
208
-
209
-
210
-
211
-
212
-
213
-
 214
214 -
 215
215 -
 216
216 -
 217
217 -
 218
218 -
 219
219 -
 220
220 -
 221
221 -
 222
222 -
 223
223 -
 224
224 -
 225
225 -
 226
226 -
 227
227 -
 228
228 -
 229
229 -
 230
230 -
 231
231 -
 232
232 -
 233
233 -
 234
234 -
235
-
236
-
237
-
238
-
239
-
240
-
241
-
242
-
243
-
244
-
245
-
246
-
247
-
248
-
249
-
250
-
251
-
252
-
253
-
254
-
255
-
256
-
257
-
258
-
259
-
260
-
261
-
262
-
263
-
264
-
265
-
266
-
267
-
268
-
269
-
270
-
271
-
272
 |
 |
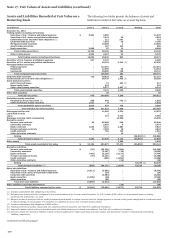
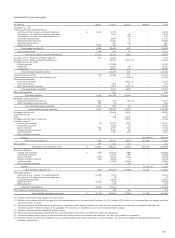
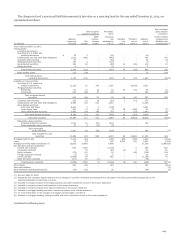
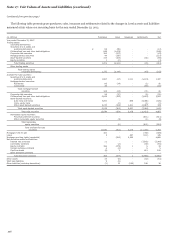
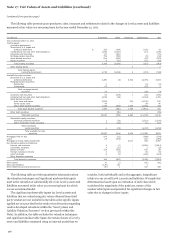
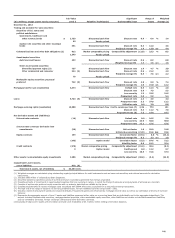
Note 17: Fair Values of Assets and Liabilities (continued)
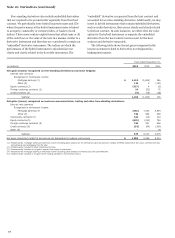
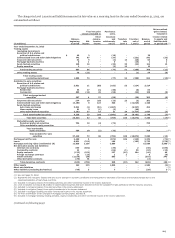
Changes in Fair Value Levels
We monitor the availability of observable market data to assess
the appropriate classification of financial instruments within the
fair value hierarchy and transfer between Level 1, Level 2, and
Level 3 accordingly. Observable market data includes but is not
limited to quoted prices and market transactions. Changes in
economic conditions or market liquidity generally will drive
changes in availability of observable market data. Changes in
availability of observable market data, which also may result in
changing the valuation technique used, are generally the cause of
transfers between Level 1, Level 2, and Level 3.
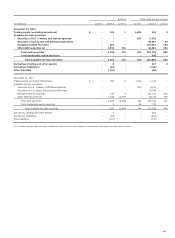
Transfers into and out of Level 1, Level 2, and Level 3 for the
periods presented are provided within the following table. The
amounts reported as transfers represent the fair value as of the
beginning of the quarter in which the transfer occurred.
- -
- -
- - -
- - - - -
- - -
- - - - - - -
-
--
--
- - -
- - -
- - -
- - - - - - -
- - $
$
$
$
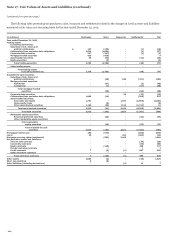
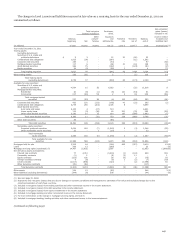
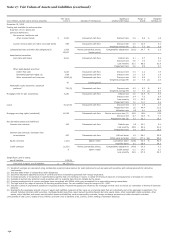
Transfers Between Fair Value Levels
Level 1 Level 2 Level 3 (1)
(in millions) In Out In Out In Out Total
Year ended December 31, 2013
Trading assets (excluding derivatives) (2) (242) 535 (56) 52 (289)
Available-for-sale securities (2)(3) 17 12,830 (117) 100 (12,830)
Mortgages held for sale 343 (336) 336 (343)
Loans 193 (193)
Net derivative assets and liabilities (4) (142) 13 (13) 142
Short sale liabilities
Total transfers 17 (242) 13,759 (496) 475 (13,513)
Year ended December 31, 2012
Trading assets (excluding derivatives) 23 16 (37) 14 (16)
Available-for-sale securities (5) 8 9,832 (68) 60 (9,832)
Mortgages held for sale 298 (488) 488 (298)
Loans (6) 41 (5,851) 5,851 (41)
Net derivative assets and liabilities 51 8 (8) (51)
Short sale liabilities
Total transfers 31 10,238 (6,436) 6,405 (10,238)
(1) All transfers in and out of Level 3 are disclosed within the recurring Level 3 rollforward table in this Note.
(2) Consists of $231 million of collateralized loan obligations classified as trading assets and $12.5 billion classified as available-for-sale securities that we transferred from Level
3 to Level 2 in 2013 as a result of increased observable market data in the valuation of such instruments.
(3) Transfers out of available-for-sale securities classified as Level 3 exclude $6.0 billion in asset-backed securities that were transferred from the available-for-sale portfolio to
held-to-maturity securities.
(4) Consists of net derivative liabilities that were transferred from Level 3 to Level 2 due to increased observable market data. Also includes net derivative liabilities that were
transferred from Level 2 to Level 3 due to a decrease in observable market data.
(5) Includes $9.4 billion of securities of U.S. states and political subdivisions that we transferred from Level 3 to Level 2 as a result of increased observable market data in the
valuation of such instruments. This transfer was done in conjunction with a change in our valuation technique from an internal model based upon unobservable inputs to
third party vendor pricing based upon market observable data.
(6) Consists of reverse mortgage loans securitized with GNMA which were accounted for as secured borrowing transactions. We transferred the loans from Level 2 to Level 3 in
third quarter 2012 due to decreased market activity and visibility to significant trades of the same or similar products. As a result, we changed our valuation technique from
an internal model based on market observable data to an internal discounted cash flow model based on unobservable inputs.
222