Wells Fargo 2013 Annual Report Download - page 237
Download and view the complete annual report
Please find page 237 of the 2013 Wells Fargo annual report below. You can navigate through the pages in the report by either clicking on the pages listed below, or by using the keyword search tool below to find specific information within the annual report.-
 1
1 -
2
-
3
-
4
-
5
-
6
-
7
-
8
-
9
-
10
-
11
-
12
-
13
-
14
-
15
-
16
-
17
-
18
-
19
-
20
-
21
-
22
-
23
-
24
-
25
-
26
-
27
-
28
-
29
-
30
-
31
-
32
-
33
-
34
-
35
-
36
-
37
-
38
-
39
-
40
-
41
-
42
-
43
-
44
-
45
-
46
-
47
-
48
-
49
-
50
-
51
-
52
-
53
-
54
-
55
-
56
-
57
-
58
-
59
-
60
-
61
-
62
-
63
-
64
-
65
-
66
-
67
-
68
-
69
-
70
-
71
-
72
-
73
-
74
-
75
-
76
-
77
-
78
-
79
-
80
-
81
-
82
-
83
-
84
-
85
-
86
-
87
-
88
-
89
-
90
-
91
-
92
-
93
-
94
-
95
-
96
-
97
-
98
-
99
-
100
-
101
-
102
-
103
-
104
-
105
-
106
-
107
-
108
-
109
-
110
-
111
-
112
-
113
-
114
-
115
-
116
-
117
-
118
-
119
-
120
-
121
-
122
-
123
-
124
-
125
-
126
-
127
-
128
-
129
-
130
-
131
-
132
-
133
-
134
-
135
-
136
-
137
-
138
-
139
-
140
-
141
-
142
-
143
-
144
-
145
-
146
-
147
-
148
-
149
-
150
-
151
-
152
-
153
-
154
-
155
-
156
-
157
-
158
-
159
-
160
-
161
-
162
-
163
-
164
-
165
-
166
-
167
-
168
-
169
-
170
-
171
-
172
-
173
-
174
-
175
-
176
-
177
-
178
-
179
-
180
-
181
-
182
-
183
-
184
-
185
-
186
-
187
-
188
-
189
-
190
-
191
-
192
-
193
-
194
-
195
-
196
-
197
-
198
-
199
-
200
-
201
-
202
-
203
-
204
-
205
-
206
-
207
-
208
-
209
-
210
-
211
-
212
-
213
-
214
-
215
-
216
-
217
-
218
-
219
-
220
-
221
-
222
-
223
-
224
-
225
-
226
-
 227
227 -
 228
228 -
 229
229 -
 230
230 -
 231
231 -
 232
232 -
 233
233 -
 234
234 -
 235
235 -
 236
236 -
 237
237 -
 238
238 -
 239
239 -
 240
240 -
 241
241 -
 242
242 -
 243
243 -
 244
244 -
 245
245 -
 246
246 -
 247
247 -
248
-
249
-
250
-
251
-
252
-
253
-
254
-
255
-
256
-
257
-
258
-
259
-
260
-
261
-
262
-
263
-
264
-
265
-
266
-
267
-
268
-
269
-
270
-
271
-
272
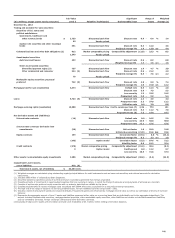
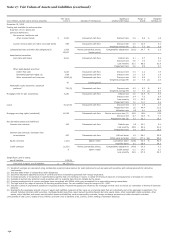
 |
 |

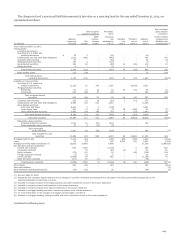
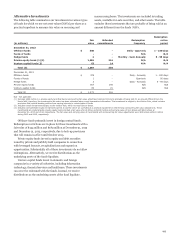
Alternative Investments
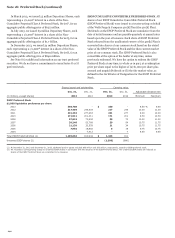
The following table summarizes our investments in various types
of funds for which we use net asset values (NAVs) per share as a
practical expedient to measure fair value on recurring and
nonrecurring bases. The investments are included in trading
assets, available-for-sale securities, and other assets. The table
excludes those investments that are probable of being sold at an
amount different from the funds’ NAVs.
(in millions)
Fair
value
Unfunded
commitments
Redemption
frequency
Redemption
notice
period
December 31, 2013
Offshore funds $ 308 - Daily - Quarterly 1 - 180 days
Funds of funds - - N/A N/A
Hedge funds 2 - Monthly - Semi Annually 5 - 95 days
Private equity funds (1)(2) 1,496 316 N/A N/A
Venture capital funds (2) 63 14 N/A N/A
Total (3) $ 1,869 330
December 31, 2012
Offshore funds $ 379 - Daily - Annually 1 - 180 days
Funds of funds 1 - Quarterly 90 days
Hedge funds 2 - Daily - Annually 5 - 95 days
Private equity funds 807 195 N/A N/A
Venture capital funds 82 21 N/A N/A
Total (3) $ 1,271 216
N/A - Not applicable
(1) Excludes $505 million in a private equity fund that had a nonrecurring fair value adjustment during 2013 and is probable of being sold for an amount different from the
fund’s NAV; therefore, the investment’s fair value has been estimated using recent transaction information. This investment is subject to the Volcker Rule, which includes
provisions that restrict banking entities from owning interests in certain types of funds.
(2) Includes certain investments subject to the Volcker Rule, which we may have to divest.
(3) Includes nonmarketable equity investments carried at cost for which we use NAVs as a practical expedient for determining nonrecurring fair value adjustments. These
investments are predominantly private equity funds and had a fair value of $1.5 billion and $816 million and carrying value of $1.4 billion and $651 million at
December 31, 2013 and 2012, respectively. The fair value and carrying value of investments with nonrecurring fair value adjustments were $88 million and $21 million
during 2013 and 2012, respectively.
Offshore funds primarily invest in foreign mutual funds.
Redemption restrictions are in place for these investments with a
fair value of $144 million and $189 million at December 31, 2013
and December 31, 2012, respectively, due to lock-up provisions
that will remain in effect until October 2015.
Private equity funds invest in equity and debt securities
issued by private and publicly-held companies in connection
with leveraged buyouts, recapitalizations and expansion
opportunities. Substantially all of these investments do not allow
redemptions. Alternatively, we receive distributions as the
underlying assets of the funds liquidate.
Venture capital funds invest in domestic and foreign
companies in a variety of industries, including information
technology, financial services and healthcare. These investments
can never be redeemed with the funds. Instead, we receive
distributions as the underlying assets of the fund liquidate.
235