Wells Fargo 2013 Annual Report Download - page 78
Download and view the complete annual report
Please find page 78 of the 2013 Wells Fargo annual report below. You can navigate through the pages in the report by either clicking on the pages listed below, or by using the keyword search tool below to find specific information within the annual report.-
 1
1 -
2
-
3
-
4
-
5
-
6
-
7
-
8
-
9
-
10
-
11
-
12
-
13
-
14
-
15
-
16
-
17
-
18
-
19
-
20
-
21
-
22
-
23
-
24
-
25
-
26
-
27
-
28
-
29
-
30
-
31
-
32
-
33
-
34
-
35
-
36
-
37
-
38
-
39
-
40
-
41
-
42
-
43
-
44
-
45
-
46
-
47
-
48
-
49
-
50
-
51
-
52
-
53
-
54
-
55
-
56
-
57
-
58
-
59
-
60
-
61
-
62
-
63
-
64
-
65
-
66
-
67
-
 68
68 -
 69
69 -
 70
70 -
 71
71 -
 72
72 -
 73
73 -
 74
74 -
 75
75 -
 76
76 -
 77
77 -
 78
78 -
 79
79 -
 80
80 -
 81
81 -
 82
82 -
 83
83 -
 84
84 -
 85
85 -
 86
86 -
 87
87 -
 88
88 -
89
-
90
-
91
-
92
-
93
-
94
-
95
-
96
-
97
-
98
-
99
-
100
-
101
-
102
-
103
-
104
-
105
-
106
-
107
-
108
-
109
-
110
-
111
-
112
-
113
-
114
-
115
-
116
-
117
-
118
-
119
-
120
-
121
-
122
-
123
-
124
-
125
-
126
-
127
-
128
-
129
-
130
-
131
-
132
-
133
-
134
-
135
-
136
-
137
-
138
-
139
-
140
-
141
-
142
-
143
-
144
-
145
-
146
-
147
-
148
-
149
-
150
-
151
-
152
-
153
-
154
-
155
-
156
-
157
-
158
-
159
-
160
-
161
-
162
-
163
-
164
-
165
-
166
-
167
-
168
-
169
-
170
-
171
-
172
-
173
-
174
-
175
-
176
-
177
-
178
-
179
-
180
-
181
-
182
-
183
-
184
-
185
-
186
-
187
-
188
-
189
-
190
-
191
-
192
-
193
-
194
-
195
-
196
-
197
-
198
-
199
-
200
-
201
-
202
-
203
-
204
-
205
-
206
-
207
-
208
-
209
-
210
-
211
-
212
-
213
-
214
-
215
-
216
-
217
-
218
-
219
-
220
-
221
-
222
-
223
-
224
-
225
-
226
-
227
-
228
-
229
-
230
-
231
-
232
-
233
-
234
-
235
-
236
-
237
-
238
-
239
-
240
-
241
-
242
-
243
-
244
-
245
-
246
-
247
-
248
-
249
-
250
-
251
-
252
-
253
-
254
-
255
-
256
-
257
-
258
-
259
-
260
-
261
-
262
-
263
-
264
-
265
-
266
-
267
-
268
-
269
-
270
-
271
-
272
 |
 |
Risk Management – Credit Risk Management (continued)
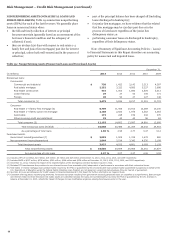
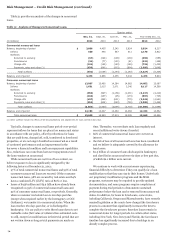
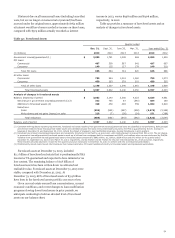
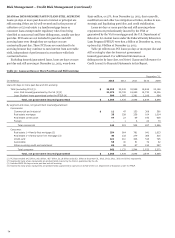
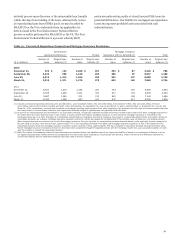
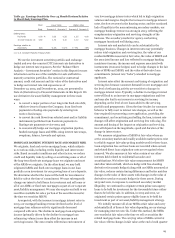
Table 37 presents net charge-offs for the four quarters and
full year of 2013 and 2012. Net charge-offs in 2013 were
$4.5 billion (0.56% of average total loans outstanding)
compared with $9.0 billion (1.17%) in 2012. We continued to
have strong improvement in our commercial and residential real
estate secured portfolios. Our commercial real estate portfolios
were in a net recovery position every quarter in 2013. Our
consumer real estate portfolios continued to benefit from the
improvement in the housing market with losses down
$3.5 billion, or 59%, from 2012.
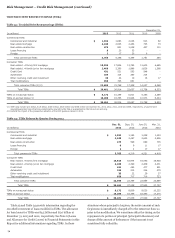
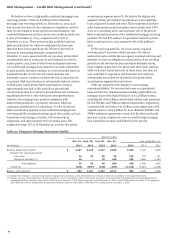
ALLOWANCE FOR CREDIT LOSSES The allowance for credit
losses, which consists of the allowance for loan losses and the
allowance for unfunded credit commitments, is management’s
estimate of credit losses inherent in the loan portfolio and
unfunded credit commitments at the balance sheet date,
excluding loans carried at fair value. The detail of the changes in
the allowance for credit losses by portfolio segment (including
charge-offs and recoveries by loan class) is in Note 6 (Loans and
Allowance for Credit Losses) to Financial Statements in this
Report.
We apply a disciplined process and methodology to establish
our allowance for credit losses each quarter. This process takes
into consideration many factors, including historical and
forecasted loss trends, loan-level credit quality ratings and loan
grade-specific loss factors. The process involves subjective and
complex judgments. In addition, we review a variety of credit
metrics and trends. These credit metrics and trends, however, do
not solely determine the amount of the allowance as we use
several analytical tools. For additional information on our
allowance for credit losses, see the “Critical Accounting Policies
– Allowance for Credit Losses” section and Note 1 (Summary of
Significant Accounting Policies) and Note 6 (Loans and
Allowance for Credit Losses) to Financial Statements in this
Report.
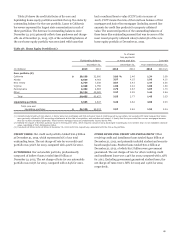
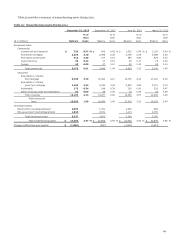
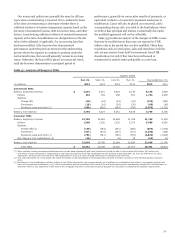
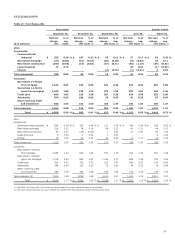
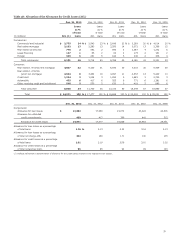
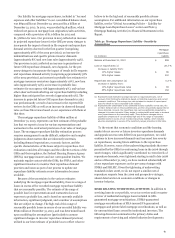
Table 38 presents the allocation of the allowance for credit
losses by loan segment and class for the last five years.
76