Wells Fargo 2013 Annual Report Download - page 47
Download and view the complete annual report
Please find page 47 of the 2013 Wells Fargo annual report below. You can navigate through the pages in the report by either clicking on the pages listed below, or by using the keyword search tool below to find specific information within the annual report.-
 1
1 -
2
-
3
-
4
-
5
-
6
-
7
-
8
-
9
-
10
-
11
-
12
-
13
-
14
-
15
-
16
-
17
-
18
-
19
-
20
-
21
-
22
-
23
-
24
-
25
-
26
-
27
-
28
-
29
-
30
-
31
-
32
-
33
-
34
-
35
-
36
-
 37
37 -
 38
38 -
 39
39 -
 40
40 -
 41
41 -
 42
42 -
 43
43 -
 44
44 -
 45
45 -
 46
46 -
 47
47 -
 48
48 -
 49
49 -
 50
50 -
 51
51 -
 52
52 -
 53
53 -
 54
54 -
 55
55 -
 56
56 -
 57
57 -
58
-
59
-
60
-
61
-
62
-
63
-
64
-
65
-
66
-
67
-
68
-
69
-
70
-
71
-
72
-
73
-
74
-
75
-
76
-
77
-
78
-
79
-
80
-
81
-
82
-
83
-
84
-
85
-
86
-
87
-
88
-
89
-
90
-
91
-
92
-
93
-
94
-
95
-
96
-
97
-
98
-
99
-
100
-
101
-
102
-
103
-
104
-
105
-
106
-
107
-
108
-
109
-
110
-
111
-
112
-
113
-
114
-
115
-
116
-
117
-
118
-
119
-
120
-
121
-
122
-
123
-
124
-
125
-
126
-
127
-
128
-
129
-
130
-
131
-
132
-
133
-
134
-
135
-
136
-
137
-
138
-
139
-
140
-
141
-
142
-
143
-
144
-
145
-
146
-
147
-
148
-
149
-
150
-
151
-
152
-
153
-
154
-
155
-
156
-
157
-
158
-
159
-
160
-
161
-
162
-
163
-
164
-
165
-
166
-
167
-
168
-
169
-
170
-
171
-
172
-
173
-
174
-
175
-
176
-
177
-
178
-
179
-
180
-
181
-
182
-
183
-
184
-
185
-
186
-
187
-
188
-
189
-
190
-
191
-
192
-
193
-
194
-
195
-
196
-
197
-
198
-
199
-
200
-
201
-
202
-
203
-
204
-
205
-
206
-
207
-
208
-
209
-
210
-
211
-
212
-
213
-
214
-
215
-
216
-
217
-
218
-
219
-
220
-
221
-
222
-
223
-
224
-
225
-
226
-
227
-
228
-
229
-
230
-
231
-
232
-
233
-
234
-
235
-
236
-
237
-
238
-
239
-
240
-
241
-
242
-
243
-
244
-
245
-
246
-
247
-
248
-
249
-
250
-
251
-
252
-
253
-
254
-
255
-
256
-
257
-
258
-
259
-
260
-
261
-
262
-
263
-
264
-
265
-
266
-
267
-
268
-
269
-
270
-
271
-
272
 |
 |
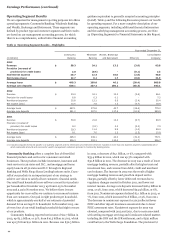
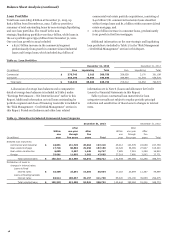
credit losses of $2.8 billion in 2013 was 60% lower than 2012,
which was $1.1 billion, or 14%, lower than 2011, due to improved
portfolio performance in both 2013 and 2012.
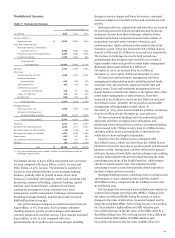
Wholesale Banking provides financial solutions to businesses
across the United States and globally with annual sales generally
in excess of $20 million. Products and business segments
include Middle Market Commercial Banking, Government and
Institutional Banking, Corporate Banking, Commercial Real
Estate, Treasury Management, Wells Fargo Capital Finance,
Insurance, International, Real Estate Capital Markets,
Commercial Mortgage Servicing, Corporate Trust, Equipment
Finance, Wells Fargo Securities, Principal Investments, Asset
Backed Finance, and Asset Management. Wholesale Banking
cross-sell was a record 7.1 products per customer in
September 2013, up from 6.8 in September 2012 and 6.5 in
September 2011.
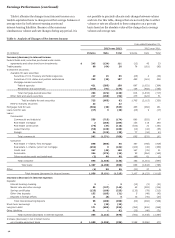
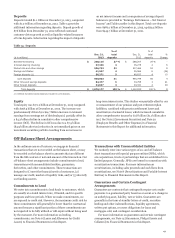
Wholesale Banking reported net income of $8.1 billion in
2013, up $359 million, or 5%, from $7.8 billion in 2012, which
was up 11% from $7.0 billion in 2011. The year over year
increase in net income during 2013 was the result of
improvement in provision for credit losses and stable revenue
performance partially offset by increased noninterest expense.
The year over year increase in net income during 2012 was the
result of strong revenue growth partially offset by increased
noninterest expense and a higher provision for credit losses.
Revenue in 2013 of $24.1 billion was flat from 2012, as business
growth from asset backed finance, asset management, capital
markets and commercial real estate was offset by lower PCI
resolution income. Revenue in 2012 of $24.1 billion increased
$2.5 billion, or 12%, from 2011, due to broad-based business
growth as well as growth from acquisitions. Net interest income
of $12.3 billion in 2013 decreased $350 million, or 3%, from
2012, which was up 9% from 2011. The decrease in 2013 was due
to a strong loan and deposit growth, which was more than offset
by lower PCI resolutions and net interest margin compression.
The increase in 2012 was driven by strong loan and deposit
growth. Average loans of $290.0 billion in 2013 increased
$16.2 billion, or 6%, from $273.8 billion in 2012, which was up
10% from $249.1 billion in 2011. The loan growth in both 2013
and 2012 was driven by strong customer demand as well as
growth from acquisitions. Average core deposits of $237.2
billion in 2013 increased $10.2 billion, or 4%, from 2012 which
was up 12%, from 2011, reflecting continued strong customer
liquidity for both years. Noninterest income of $11.8 billion in
2013 increased $322 million, or 3%, from 2012 due to strong
growth in asset backed finance, asset management, capital
markets, commercial banking, commercial real estate and
corporate banking. Noninterest income of $11.4 billion in 2012
increased $1.5 billion, or 15%, from 2011 due to strong growth in
asset backed finance, capital markets, commercial banking,
commercial real estate and real estate capital markets. Total
noninterest expense in 2013 increased $296 million, or 2%,
compared with 2012, which was up 8%, or $905 million, from
2011. The increase in both 2013 and 2012 was due to higher
personnel expenses and higher non-personnel expenses related
to growth initiatives and compliance and regulatory
requirements, partially offset in 2013 by lower foreclosed asset
expenses. The provision for credit losses decreased $731 million
from 2012, due to lower loan losses, while the provision for
credit losses increased $396 million in 2012 from 2011, as a
$319 million decline in loan losses was more than offset by a
provision for increase in loans, particularly from acquisitions.
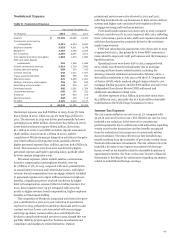
Wealth, Brokerage and Retirement provides a full range of
financial advisory services to clients using a planning approach
to meet each client's financial needs. Wealth Management
provides affluent and high net worth clients with a complete
range of wealth management solutions, including financial
planning, private banking, credit, investment management and
fiduciary services. Abbot Downing, a Wells Fargo business,
provides comprehensive wealth management services to ultra
high net worth families and individuals as well as endowments
and foundations. Brokerage serves customers' advisory,
brokerage and financial needs as part of one of the largest full-
service brokerage firms in the United States. Retirement is a
national leader in providing institutional retirement and trust
services (including 401(k) and pension plan record keeping) for
businesses, retail retirement solutions for individuals, and
reinsurance services for the life insurance industry. Wealth,
Brokerage and Retirement cross-sell reached a record
10.42 products per household in November 2013, up from
10.27 in November 2012 and 10.05 in November 2011.
Wealth, Brokerage and Retirement reported net income of
$1.7 billion in 2013, up $384 million, or 29%, from 2012, which
was up 4% from $1.3 billion in 2011. Net income growth in 2013
was driven by higher noninterest income and improved credit
quality. Growth in net income for 2012 was affected by the
$153 million gain on the sale of the H.D. Vest Financial Services
business included in the 2011 results. Revenue of $13.2 billion in
2013 increased $1.0 billion from 2012, which was flat compared
with 2011. The increase in revenue for 2013 was due to increases
in both net interest income and noninterest income. Net interest
income increased 4% in 2013, due to growth in loan balances
and low-cost core deposits, partially offset by lower interest rates
on the loan and investment portfolios. Net interest income
decreased 3% in 2012 due to lower interest rates on the loan and
investment portfolios partially offset by the impact of growth in
low-cost core deposits. Average core deposits in 2013 of
$150.1 billion increased 9% from 2012, which was up 6% from
2011. Noninterest income increased 10% in 2013 from 2012,
largely due to strong growth in asset-based fees from improved
market performance and growth in assets under management,
partially offset by reduced securities gains in the brokerage
business. A slight increase of $59 million in noninterest income
in 2012 compared with 2011 was due to higher asset-based fees
and gains on deferred compensation plan investments (offset in
expense), partially offset by the 2011 gain on the sale of H.D.
Vest Financial Services business, lower transaction revenue and
reduced securities gains in the brokerage business. Noninterest
expense for 2013 was up 6% from 2012, which was flat from
2011. The increase in 2013 was predominantly due to higher
personnel expenses, primarily reflecting increased broker
commissions. Noninterest expense for 2012 included the impact
of deferred compensation plan expense (offset in revenue). Total
provision for credit losses improved for both 2013 and 2012,
45