Wells Fargo 2013 Annual Report Download - page 165
Download and view the complete annual report
Please find page 165 of the 2013 Wells Fargo annual report below. You can navigate through the pages in the report by either clicking on the pages listed below, or by using the keyword search tool below to find specific information within the annual report.-
 1
1 -
2
-
3
-
4
-
5
-
6
-
7
-
8
-
9
-
10
-
11
-
12
-
13
-
14
-
15
-
16
-
17
-
18
-
19
-
20
-
21
-
22
-
23
-
24
-
25
-
26
-
27
-
28
-
29
-
30
-
31
-
32
-
33
-
34
-
35
-
36
-
37
-
38
-
39
-
40
-
41
-
42
-
43
-
44
-
45
-
46
-
47
-
48
-
49
-
50
-
51
-
52
-
53
-
54
-
55
-
56
-
57
-
58
-
59
-
60
-
61
-
62
-
63
-
64
-
65
-
66
-
67
-
68
-
69
-
70
-
71
-
72
-
73
-
74
-
75
-
76
-
77
-
78
-
79
-
80
-
81
-
82
-
83
-
84
-
85
-
86
-
87
-
88
-
89
-
90
-
91
-
92
-
93
-
94
-
95
-
96
-
97
-
98
-
99
-
100
-
101
-
102
-
103
-
104
-
105
-
106
-
107
-
108
-
109
-
110
-
111
-
112
-
113
-
114
-
115
-
116
-
117
-
118
-
119
-
120
-
121
-
122
-
123
-
124
-
125
-
126
-
127
-
128
-
129
-
130
-
131
-
132
-
133
-
134
-
135
-
136
-
137
-
138
-
139
-
140
-
141
-
142
-
143
-
144
-
145
-
146
-
147
-
148
-
149
-
150
-
151
-
152
-
153
-
154
-
 155
155 -
 156
156 -
 157
157 -
 158
158 -
 159
159 -
 160
160 -
 161
161 -
 162
162 -
 163
163 -
 164
164 -
 165
165 -
 166
166 -
 167
167 -
 168
168 -
 169
169 -
 170
170 -
 171
171 -
 172
172 -
 173
173 -
 174
174 -
 175
175 -
176
-
177
-
178
-
179
-
180
-
181
-
182
-
183
-
184
-
185
-
186
-
187
-
188
-
189
-
190
-
191
-
192
-
193
-
194
-
195
-
196
-
197
-
198
-
199
-
200
-
201
-
202
-
203
-
204
-
205
-
206
-
207
-
208
-
209
-
210
-
211
-
212
-
213
-
214
-
215
-
216
-
217
-
218
-
219
-
220
-
221
-
222
-
223
-
224
-
225
-
226
-
227
-
228
-
229
-
230
-
231
-
232
-
233
-
234
-
235
-
236
-
237
-
238
-
239
-
240
-
241
-
242
-
243
-
244
-
245
-
246
-
247
-
248
-
249
-
250
-
251
-
252
-
253
-
254
-
255
-
256
-
257
-
258
-
259
-
260
-
261
-
262
-
263
-
264
-
265
-
266
-
267
-
268
-
269
-
270
-
271
-
272
 |
 |

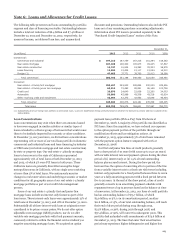
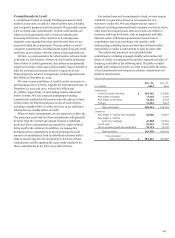
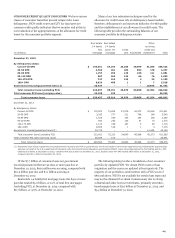
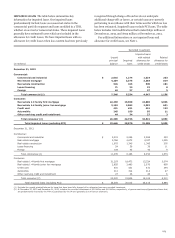
Note 6: Loans and Allowance for Credit Losses
The following table presents total loans outstanding by portfolio
segment and class of financing receivable. Outstanding balances
include a total net reduction of $6.4 billion and $7.4 billion at
December 31, 2013 and December 31, 2012, respectively, for
unearned income, net deferred loan fees, and unamortized
discounts and premiums. Outstanding balances also include PCI
loans net of any remaining purchase accounting adjustments.
Information about PCI loans is presented separately in the
“Purchased Credit-Impaired Loans” section of this Note.
December 31,
(in millions) 2013 2012 2011 2010 2009
Commercial:
Commercial and industrial $ 197,210 187,759 167,216 151,284 158,352
Real estate mortgage 107,100 106,340 105,975 99,435 97,527
Real estate construction 16,747 16,904 19,382 25,333 36,978
Lease financing 12,034 12,424 13,117 13,094 14,210
Foreign (1) 47,665 37,771 39,760 32,912 29,398
Total commercial 380,756 361,198 345,450 322,058 336,465
Consumer:
Real estate 1-4 family first mortgage 258,497 249,900 228,894 230,235 229,536
Real estate 1-4 family junior lien mortgage 65,914 75,465 85,991 96,149 103,708
Credit card 26,870 24,640 22,836 22,260 24,003
Automobile 50,808 45,998 43,508 43,516 42,624
Other revolving credit and installment 42,954 42,373 42,952 43,049 46,434
Total consumer 445,043 438,376 424,181 435,209 446,305
Total loans $ 825,799 799,574 769,631 757,267 782,770
(1) Substantially all of our foreign loan portfolio is commercial loans. Loans are classified as foreign primarily based on whether the borrower’s primary address is outside of the
United States.
Loan Concentrations
Loan concentrations may exist when there are amounts loaned
to borrowers engaged in similar activities or similar types of
loans extended to a diverse group of borrowers that would cause
them to be similarly impacted by economic or other conditions.
At December 31, 2013 and 2012, we did not have concentrations
representing 10% or more of our total loan portfolio in domestic
commercial and industrial loans and lease financing by industry
or CRE loans (real estate mortgage and real estate construction)
by state or property type. Our real estate 1-4 family mortgage
loans to borrowers in the state of California represented
approximately 13% of total loans at both December 31, 2013
and 2012, of which 2% were PCI loans in both years. These
California loans are generally diversified among the larger
metropolitan areas in California, with no single area consisting
of more than 3% of total loans. We continuously monitor
changes in real estate values and underlying economic or market
conditions for all geographic areas of our real estate 1-4 family
mortgage portfolio as part of our credit risk management
process.
Some of our real estate 1-4 family first and junior lien
mortgage loans include an interest-only feature as part of the
loan terms. These interest-only loans were approximately 15% of
total loans at December 31, 2013, and 18% at December 31, 2012.
Substantially all of these interest-only loans at origination were
considered to be prime or near prime. We do not offer option
adjustable-rate mortgage (ARM) products, nor do we offer
variable-rate mortgage products with fixed payment amounts,
commonly referred to within the financial services industry as
negative amortizing mortgage loans. We acquired an option
payment loan portfolio (Pick-a-Pay) from Wachovia at
December 31, 2008. A majority of the portfolio was identified as
PCI loans. Since the acquisition, we have reduced our exposure
to the option payment portion of the portfolio through our
modification efforts and loss mitigation actions. At
December 31, 2013, approximately 3% of total loans remained
with the payment option feature compared with 10% at
December 31, 2008.
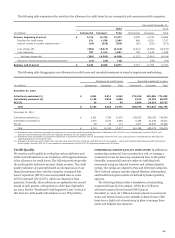
Our first and junior lien lines of credit products generally
have a draw period of 10 years (with some up to 15 or 20 years)
with variable interest rate and payment options during the draw
period of (1) interest only or (2) 1.5% of total outstanding
balance plus accrued interest. During the draw period, the
borrower has the option of converting all or a portion of the line
from a variable interest rate to a fixed rate with terms including
interest-only payments for a fixed period between three to seven
years or a fully amortizing payment with a fixed period between
five to 30 years. At the end of the draw period, a line of credit
generally converts to an amortizing payment schedule with
repayment terms of up to 30 years based on the balance at time
of conversion. At December 31, 2013, our lines of credit portfolio
had an outstanding balance of $75.7 billion, of which
$3.9 billion, or 5%, is in its amortization period, another
$11.6 billion, or 15%, of our total outstanding balance, will reach
their end of draw period during 2014 through 2015,
$22.8 billion, or 30%, during 2016 through 2018, and
$37.4 billion, or 50%, will convert in subsequent years. This
portfolio had unfunded credit commitments of $73.6 billion at
December 31, 2013. The lines that enter their amortization
period may experience higher delinquencies and higher loss
163