Wells Fargo 2013 Annual Report Download - page 197
Download and view the complete annual report
Please find page 197 of the 2013 Wells Fargo annual report below. You can navigate through the pages in the report by either clicking on the pages listed below, or by using the keyword search tool below to find specific information within the annual report.-
 1
1 -
2
-
3
-
4
-
5
-
6
-
7
-
8
-
9
-
10
-
11
-
12
-
13
-
14
-
15
-
16
-
17
-
18
-
19
-
20
-
21
-
22
-
23
-
24
-
25
-
26
-
27
-
28
-
29
-
30
-
31
-
32
-
33
-
34
-
35
-
36
-
37
-
38
-
39
-
40
-
41
-
42
-
43
-
44
-
45
-
46
-
47
-
48
-
49
-
50
-
51
-
52
-
53
-
54
-
55
-
56
-
57
-
58
-
59
-
60
-
61
-
62
-
63
-
64
-
65
-
66
-
67
-
68
-
69
-
70
-
71
-
72
-
73
-
74
-
75
-
76
-
77
-
78
-
79
-
80
-
81
-
82
-
83
-
84
-
85
-
86
-
87
-
88
-
89
-
90
-
91
-
92
-
93
-
94
-
95
-
96
-
97
-
98
-
99
-
100
-
101
-
102
-
103
-
104
-
105
-
106
-
107
-
108
-
109
-
110
-
111
-
112
-
113
-
114
-
115
-
116
-
117
-
118
-
119
-
120
-
121
-
122
-
123
-
124
-
125
-
126
-
127
-
128
-
129
-
130
-
131
-
132
-
133
-
134
-
135
-
136
-
137
-
138
-
139
-
140
-
141
-
142
-
143
-
144
-
145
-
146
-
147
-
148
-
149
-
150
-
151
-
152
-
153
-
154
-
155
-
156
-
157
-
158
-
159
-
160
-
161
-
162
-
163
-
164
-
165
-
166
-
167
-
168
-
169
-
170
-
171
-
172
-
173
-
174
-
175
-
176
-
177
-
178
-
179
-
180
-
181
-
182
-
183
-
184
-
185
-
186
-
 187
187 -
 188
188 -
 189
189 -
 190
190 -
 191
191 -
 192
192 -
 193
193 -
 194
194 -
 195
195 -
 196
196 -
 197
197 -
 198
198 -
 199
199 -
 200
200 -
 201
201 -
 202
202 -
 203
203 -
 204
204 -
 205
205 -
 206
206 -
 207
207 -
208
-
209
-
210
-
211
-
212
-
213
-
214
-
215
-
216
-
217
-
218
-
219
-
220
-
221
-
222
-
223
-
224
-
225
-
226
-
227
-
228
-
229
-
230
-
231
-
232
-
233
-
234
-
235
-
236
-
237
-
238
-
239
-
240
-
241
-
242
-
243
-
244
-
245
-
246
-
247
-
248
-
249
-
250
-
251
-
252
-
253
-
254
-
255
-
256
-
257
-
258
-
259
-
260
-
261
-
262
-
263
-
264
-
265
-
266
-
267
-
268
-
269
-
270
-
271
-
272
 |
 |

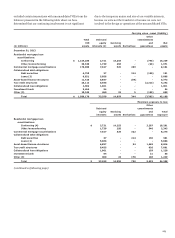
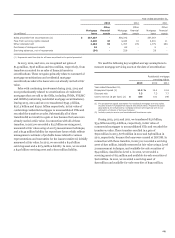
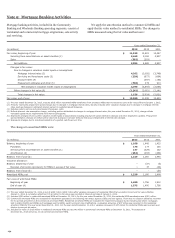
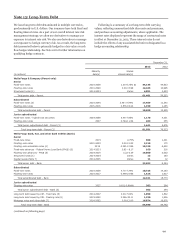
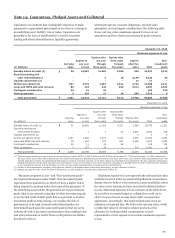
We present the components of our managed servicing
portfolio in the following table at unpaid principal balance for
loans serviced and subserviced for others and at book value for
owned loans serviced.
December 31,
(in billions) 2013 2012
Residential mortgage servicing:
Serviced for others $ 1,485 1,498
Owned loans serviced 338 368
Subservicing 6 7
Total residential servicing 1,829 1,873
Commercial mortgage servicing:
Serviced for others 419 408
Owned loans serviced 107 106
Subservicing 7 13
Total commercial servicing 533 527
Total managed servicing portfolio $ 2,362 2,400
Total serviced for others $ 1,904 1,906
Ratio of MSRs to related loans serviced for others 0.88 % 0.67
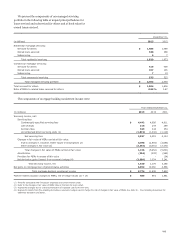
The components of mortgage banking noninterest income were:
Year ended December 31,
(in millions) 2013 2012 2011
Servicing income, net:
Servicing fees
Contractually specified servicing fees $ 4,442 4,626 4,611
Late charges 216 257 298
Ancillary fees 343 342 354
Unreimbursed direct servicing costs (1) (1,074) (1,234) (1,119)
Net servicing fees 3,927 3,991 4,144
Changes in fair value of MSRs carried at fair value:
Due to changes in valuation model inputs or assumptions (2) 3,398 (2,893) (3,680)
Other changes in fair value (3) (2,242) (3,061) (2,141)
Total changes in fair value of MSRs carried at fair value 1,156 (5,954) (5,821)
Amortization (254) (233) (264)
Provision for MSRs in excess of fair value - - (34)
Net derivative gains (losses) from economic hedges (4) (2,909) 3,574 5,241
Total servicing income, net 1,920 1,378 3,266
Net gains on mortgage loan origination/sales activities 6,854 10,260 4,566
Total mortgage banking noninterest income $ 8,774 11,638 7,832
Market-related valuation changes to MSRs, net of hedge results (2) + (4) $ 489 681 1,561
(1) Primarily associated with foreclosure expenses and certain interest costs.
(2) Refer to the changes in fair value of MSRs table in this Note for more detail.
(3) Represents changes due to collection/realization of expected cash flows over time.
(4) Represents results from free-standing derivatives (economic hedges) used to hedge the risk of changes in fair value of MSRs. See Note 16 – Free-Standing Derivatives for
additional discussion and detail.
195