Wells Fargo 2013 Annual Report Download - page 252
Download and view the complete annual report
Please find page 252 of the 2013 Wells Fargo annual report below. You can navigate through the pages in the report by either clicking on the pages listed below, or by using the keyword search tool below to find specific information within the annual report.-
 1
1 -
2
-
3
-
4
-
5
-
6
-
7
-
8
-
9
-
10
-
11
-
12
-
13
-
14
-
15
-
16
-
17
-
18
-
19
-
20
-
21
-
22
-
23
-
24
-
25
-
26
-
27
-
28
-
29
-
30
-
31
-
32
-
33
-
34
-
35
-
36
-
37
-
38
-
39
-
40
-
41
-
42
-
43
-
44
-
45
-
46
-
47
-
48
-
49
-
50
-
51
-
52
-
53
-
54
-
55
-
56
-
57
-
58
-
59
-
60
-
61
-
62
-
63
-
64
-
65
-
66
-
67
-
68
-
69
-
70
-
71
-
72
-
73
-
74
-
75
-
76
-
77
-
78
-
79
-
80
-
81
-
82
-
83
-
84
-
85
-
86
-
87
-
88
-
89
-
90
-
91
-
92
-
93
-
94
-
95
-
96
-
97
-
98
-
99
-
100
-
101
-
102
-
103
-
104
-
105
-
106
-
107
-
108
-
109
-
110
-
111
-
112
-
113
-
114
-
115
-
116
-
117
-
118
-
119
-
120
-
121
-
122
-
123
-
124
-
125
-
126
-
127
-
128
-
129
-
130
-
131
-
132
-
133
-
134
-
135
-
136
-
137
-
138
-
139
-
140
-
141
-
142
-
143
-
144
-
145
-
146
-
147
-
148
-
149
-
150
-
151
-
152
-
153
-
154
-
155
-
156
-
157
-
158
-
159
-
160
-
161
-
162
-
163
-
164
-
165
-
166
-
167
-
168
-
169
-
170
-
171
-
172
-
173
-
174
-
175
-
176
-
177
-
178
-
179
-
180
-
181
-
182
-
183
-
184
-
185
-
186
-
187
-
188
-
189
-
190
-
191
-
192
-
193
-
194
-
195
-
196
-
197
-
198
-
199
-
200
-
201
-
202
-
203
-
204
-
205
-
206
-
207
-
208
-
209
-
210
-
211
-
212
-
213
-
214
-
215
-
216
-
217
-
218
-
219
-
220
-
221
-
222
-
223
-
224
-
225
-
226
-
227
-
228
-
229
-
230
-
231
-
232
-
233
-
234
-
235
-
236
-
237
-
238
-
239
-
240
-
241
-
 242
242 -
 243
243 -
 244
244 -
 245
245 -
 246
246 -
 247
247 -
 248
248 -
 249
249 -
 250
250 -
 251
251 -
 252
252 -
 253
253 -
 254
254 -
 255
255 -
 256
256 -
 257
257 -
 258
258 -
 259
259 -
 260
260 -
 261
261 -
 262
262 -
263
-
264
-
265
-
266
-
267
-
268
-
269
-
270
-
271
-
272
 |
 |

Note 20: Employee Benefits and Other Expenses (continued)
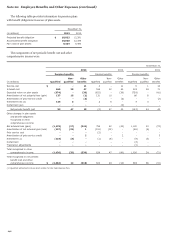
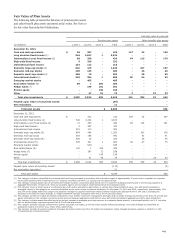
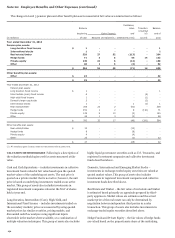
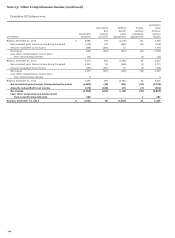
The changes in Level 3 pension plan and other benefit plan assets measured at fair value are summarized as follows:
(in millions)
Balance
beginning
of year
Gains (losses)
Purchases,
sales
and
settlements (net)
Transfers
Into/(Out
of)
Level 3
Balance
end of
year Realized Unrealized (1)
Year ended December 31, 2013
Pension plan assets:
Long duration fixed income $ 1 --- - 1
International stocks 1 ----1
Real estate/timber 328 27 52 (113) -294
Hedge funds 71 5 6 56 14 152
Private equity 145 19 6 (12) -158
Other 48 1 5 (2) -52
Other benefits plan assets:
$ 594 52 69 (71) 14 658
Other $ 22 - - - - 22
Year ended December 31, 2012
$ 22 - - - - 22
Pension plan assets:
Long duration fixed income $ 1 - - - - 1
Intermediate (core) fixed income 6 - - - (6) -
High-yield fixed income 1 - - - (1) -
Domestic large-cap stocks 2 - - - (2) -
International stocks 1 - - 1 (1) 1
Real estate/timber 355 22 2 (51) - 328
Hedge funds 251 1 2 8 (191) 71
Private equity 129 8 10 (2) - 145
Other 46 1 3 (2) - 48
Other benefits plan assets:
$ 792 32 17 (46) (201) 594
Real estate/timber $ 12 - - (12) - -
Hedge funds 8 - - (8) - -
Private equity 4 - - (4) - -
Other 23 - - (1) - 22
$ 47 - - (25) - 22
(1) All unrealized gains (losses) relate to instruments held at period end.
VALUATION METHODOLOGIES Following is a description of
the valuation methodologies used for assets measured at fair
value.
Cash and Cash Equivalents – includes investments in collective
investment funds valued at fair value based upon the quoted
market values of the underlying net assets. The unit price is
quoted on a private market that is not active; however, the unit
price is based on underlying investments traded on an active
market. This group of assets also includes investments in
registered investment companies valued at the NAV of shares
held at year end.
Long Duration, Intermediate (Core), High-Yield, and
International Fixed Income – includes investments traded on
the secondary markets; prices are measured by using quoted
market prices for similar securities, pricing models, and
discounted cash flow analyses using significant inputs
observable in the market where available, or a combination of
multiple valuation techniques. This group of assets also includes
highly liquid government securities such as U.S. Treasuries, and
registered investment companies and collective investment
funds described above.
Domestic, International and Emerging Market Stocks –
investments in exchange-traded equity securities are valued at
quoted market values. This group of assets also includes
investments in registered investment companies and collective
investment funds described above.
Real Estate and Timber – the fair value of real estate and timber
is estimated based primarily on appraisals prepared by third-
party appraisers. Market values are estimates and the actual
market price of the real estate can only be determined by
negotiation between independent third parties in a sales
transaction. This group of assets also includes investments in
exchange-traded equity securities described above.
Hedge Funds and Private Equity – the fair values of hedge funds
are valued based on the proportionate share of the underlying
250