Wells Fargo 2013 Annual Report Download - page 205
Download and view the complete annual report
Please find page 205 of the 2013 Wells Fargo annual report below. You can navigate through the pages in the report by either clicking on the pages listed below, or by using the keyword search tool below to find specific information within the annual report.-
 1
1 -
2
-
3
-
4
-
5
-
6
-
7
-
8
-
9
-
10
-
11
-
12
-
13
-
14
-
15
-
16
-
17
-
18
-
19
-
20
-
21
-
22
-
23
-
24
-
25
-
26
-
27
-
28
-
29
-
30
-
31
-
32
-
33
-
34
-
35
-
36
-
37
-
38
-
39
-
40
-
41
-
42
-
43
-
44
-
45
-
46
-
47
-
48
-
49
-
50
-
51
-
52
-
53
-
54
-
55
-
56
-
57
-
58
-
59
-
60
-
61
-
62
-
63
-
64
-
65
-
66
-
67
-
68
-
69
-
70
-
71
-
72
-
73
-
74
-
75
-
76
-
77
-
78
-
79
-
80
-
81
-
82
-
83
-
84
-
85
-
86
-
87
-
88
-
89
-
90
-
91
-
92
-
93
-
94
-
95
-
96
-
97
-
98
-
99
-
100
-
101
-
102
-
103
-
104
-
105
-
106
-
107
-
108
-
109
-
110
-
111
-
112
-
113
-
114
-
115
-
116
-
117
-
118
-
119
-
120
-
121
-
122
-
123
-
124
-
125
-
126
-
127
-
128
-
129
-
130
-
131
-
132
-
133
-
134
-
135
-
136
-
137
-
138
-
139
-
140
-
141
-
142
-
143
-
144
-
145
-
146
-
147
-
148
-
149
-
150
-
151
-
152
-
153
-
154
-
155
-
156
-
157
-
158
-
159
-
160
-
161
-
162
-
163
-
164
-
165
-
166
-
167
-
168
-
169
-
170
-
171
-
172
-
173
-
174
-
175
-
176
-
177
-
178
-
179
-
180
-
181
-
182
-
183
-
184
-
185
-
186
-
187
-
188
-
189
-
190
-
191
-
192
-
193
-
194
-
 195
195 -
 196
196 -
 197
197 -
 198
198 -
 199
199 -
 200
200 -
 201
201 -
 202
202 -
 203
203 -
 204
204 -
 205
205 -
 206
206 -
 207
207 -
 208
208 -
 209
209 -
 210
210 -
 211
211 -
 212
212 -
 213
213 -
 214
214 -
 215
215 -
216
-
217
-
218
-
219
-
220
-
221
-
222
-
223
-
224
-
225
-
226
-
227
-
228
-
229
-
230
-
231
-
232
-
233
-
234
-
235
-
236
-
237
-
238
-
239
-
240
-
241
-
242
-
243
-
244
-
245
-
246
-
247
-
248
-
249
-
250
-
251
-
252
-
253
-
254
-
255
-
256
-
257
-
258
-
259
-
260
-
261
-
262
-
263
-
264
-
265
-
266
-
267
-
268
-
269
-
270
-
271
-
272
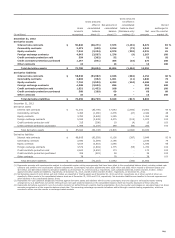
 |
 |

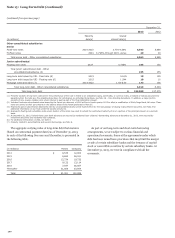
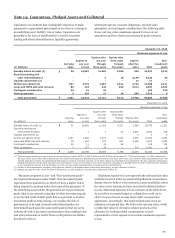
CONTINGENT CONSIDERATION In connection with certain
brokerage, asset management, insurance agency and other
acquisitions we have made, the terms of the acquisition
agreements provide for deferred payments or additional
consideration, based on certain performance targets.
OTHER GUARANTEES We are members of exchanges and
clearing houses that we use to clear our trades and those of our
customers. It is common that all members in these organizations
are required to collectively guarantee the performance of other
members. Our obligations under the guarantees are based on
either a fixed amount or a multiple of the collateral we are
required to maintain with these organizations. We have not
recorded a liability for these arrangements as of the dates
presented in the previous table because we believe the likelihood
of loss is remote.
We also have contingent performance arrangements related
to various customer relationships and lease transactions. We are
required to pay the counterparties to these agreements if third
parties default on certain obligations.
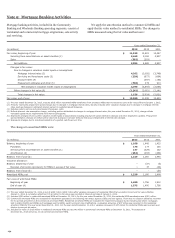
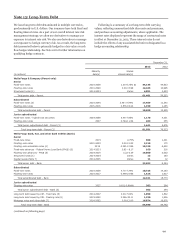
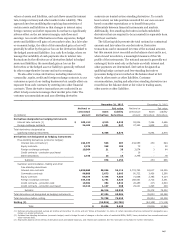
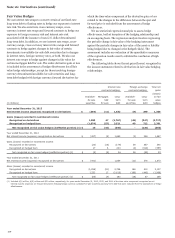
Pledged Assets
As part of our liquidity management strategy, we pledge assets to
secure trust and public deposits, borrowings and letters of credit
from the FHLB and FRB, securities sold under agreements to
repurchase (repurchase agreements), and for other purposes as
required or permitted by law or insurance statutory
requirements. The types of collateral we pledge include
securities issued by federal agencies, government-sponsored
entities (GSEs), domestic and foreign companies and various
commercial and consumer loans. The following table provides
the total carrying amount of pledged assets by asset type, of
which substantially all are pursuant to agreements that do not
permit the secured party to sell or repledge the collateral. The
table excludes pledged consolidated VIE assets of $8.1 billion
and $14.6 billion at December 31, 2013, and December 31, 2012,
respectively, which can only be used to settle the liabilities of
those entities. The table also excludes $15.3 billion and
$22.3 billion in assets pledged in transactions accounted for as
secured borrowings at December 31, 2013 and
December 31, 2012, respectively. See Note 8 for additional
information on consolidated VIE assets and secured borrowings.
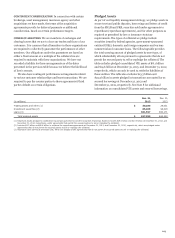
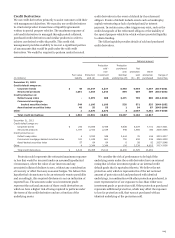
$
$
(in millions)
Dec. 31,
2013
Dec. 31,
2012
Trading assets and other (1) 30,288 28,031
Investment securities (2) 85,468 96,018
Loans (3) 381,597 360,171
Total pledged assets 497,353 484,220
(1) Represent assets pledged to collateralize repurchase agreements and other securities financings. Balance includes $29.0 billion and $27.4 billion at December 31, 2013, and
December 31, 2012, respectively, under agreements that permit the secured parties to sell or repledge the collateral.
(2) Includes $8.7 billion and $8.4 billion in collateral for repurchase agreements at December 31, 2013, and December 31, 2012, respectively, which are pledged under
agreements that do not permit the secured parties to sell or repledge the collateral.
(3) Represent loans carried at amortized cost, which are pledged under agreements that do not permit the secured parties to sell or repledge the collateral.
203