Wells Fargo 2013 Annual Report Download - page 142
Download and view the complete annual report
Please find page 142 of the 2013 Wells Fargo annual report below. You can navigate through the pages in the report by either clicking on the pages listed below, or by using the keyword search tool below to find specific information within the annual report.-
 1
1 -
2
-
3
-
4
-
5
-
6
-
7
-
8
-
9
-
10
-
11
-
12
-
13
-
14
-
15
-
16
-
17
-
18
-
19
-
20
-
21
-
22
-
23
-
24
-
25
-
26
-
27
-
28
-
29
-
30
-
31
-
32
-
33
-
34
-
35
-
36
-
37
-
38
-
39
-
40
-
41
-
42
-
43
-
44
-
45
-
46
-
47
-
48
-
49
-
50
-
51
-
52
-
53
-
54
-
55
-
56
-
57
-
58
-
59
-
60
-
61
-
62
-
63
-
64
-
65
-
66
-
67
-
68
-
69
-
70
-
71
-
72
-
73
-
74
-
75
-
76
-
77
-
78
-
79
-
80
-
81
-
82
-
83
-
84
-
85
-
86
-
87
-
88
-
89
-
90
-
91
-
92
-
93
-
94
-
95
-
96
-
97
-
98
-
99
-
100
-
101
-
102
-
103
-
104
-
105
-
106
-
107
-
108
-
109
-
110
-
111
-
112
-
113
-
114
-
115
-
116
-
117
-
118
-
119
-
120
-
121
-
122
-
123
-
124
-
125
-
126
-
127
-
128
-
129
-
130
-
131
-
 132
132 -
 133
133 -
 134
134 -
 135
135 -
 136
136 -
 137
137 -
 138
138 -
 139
139 -
 140
140 -
 141
141 -
 142
142 -
 143
143 -
 144
144 -
 145
145 -
 146
146 -
 147
147 -
 148
148 -
 149
149 -
 150
150 -
 151
151 -
 152
152 -
153
-
154
-
155
-
156
-
157
-
158
-
159
-
160
-
161
-
162
-
163
-
164
-
165
-
166
-
167
-
168
-
169
-
170
-
171
-
172
-
173
-
174
-
175
-
176
-
177
-
178
-
179
-
180
-
181
-
182
-
183
-
184
-
185
-
186
-
187
-
188
-
189
-
190
-
191
-
192
-
193
-
194
-
195
-
196
-
197
-
198
-
199
-
200
-
201
-
202
-
203
-
204
-
205
-
206
-
207
-
208
-
209
-
210
-
211
-
212
-
213
-
214
-
215
-
216
-
217
-
218
-
219
-
220
-
221
-
222
-
223
-
224
-
225
-
226
-
227
-
228
-
229
-
230
-
231
-
232
-
233
-
234
-
235
-
236
-
237
-
238
-
239
-
240
-
241
-
242
-
243
-
244
-
245
-
246
-
247
-
248
-
249
-
250
-
251
-
252
-
253
-
254
-
255
-
256
-
257
-
258
-
259
-
260
-
261
-
262
-
263
-
264
-
265
-
266
-
267
-
268
-
269
-
270
-
271
-
272
 |
 |

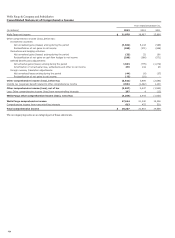
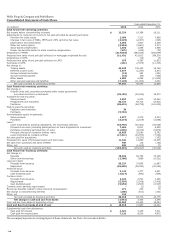
Wells Fargo & Company and Subsidiaries
Consolidated Statement of Cash Flows
Year ended December 31,
(in millions) 2013 2012 2011
Cash flows from operating activities:
Net income before noncontrolling interests $ 22,224 19,368 16,211
Adjustments to reconcile net income to net cash provided by operating activities:
Provision for credit losses 2,309 7,217 7,899
Changes in fair value of MSRs, MHFS and LHFS carried at fair value (3,229) (2,307) (295)
Depreciation and amortization 3,293 2,807 2,208
Other net losses (gains) (9,384) (3,661) 3,273
Stock-based compensation 1,920 1,698 1,488
Excess tax benefits related to stock incentive compensation (271) (226) (79)
Originations of MHFS (317,054) (483,835) (345,099)
Proceeds from sales of and principal collected on mortgages originated for sale 311,431 421,623 298,524
Originations of LHFS - (15) (5)
Proceeds from sales of and principal collected on LHFS 575 9,383 11,833
Purchases of LHFS (291) (7,975) (11,723)
Net change in:
Trading assets 43,638 105,440 35,149
Deferred income taxes 4,977 (1,297) 3,573
Accrued interest receivable (13) 293 (401)
Accrued interest payable (32) (84) (362)
Other assets 4,693 2,064 (11,529)
Other accrued expenses and liabilities (7,145) (11,953) 3,000
Net cash provided by operating activities 57,641 58,540 13,665
Cash flows from investing activities:
Net change in:
Federal funds sold, securities purchased under resale agreements
and other short-term investments (78,184) (92,946) 36,270
Available-for-sale securities:
Sales proceeds 2,837 5,210 23,062
Prepayments and maturities 50,737 59,712 52,618
Purchases (89,474) (64,756) (121,235)
Held-to-maturity securities:
Paydowns and maturities 30 - -
Purchases (5,782) - -
Nonmarketable equity investments:
Sales proceeds 2,577 2,279 2,424
Purchases (3,273) (2,619) (2,656)
Loans:
Loans originated by banking subsidiaries, net of principal collected (43,744) (53,381) (38,526)
Proceeds from sales (including participations) of loans originated for investment 7,694 6,811 6,555
Purchases (including participations) of loans (11,563) (9,040) (8,878)
Principal collected on nonbank entities’ loans 19,955 25,080 9,782
Loans originated by nonbank entities (17,311) (23,555) (7,522)
Net cash paid for acquisitions - (4,322) (353)
Proceeds from sales of foreclosed assets and short sales 11,021 12,690 13,495
Net cash from purchases and sales of MSRs 407 116 (155)
Other, net 581 (1,169) 75
Net cash used by investing activities (153,492) (139,890) (35,044)
Cash flows from financing activities:
Net change in:
Deposits 76,342 82,762 72,128
Short-term borrowings (3,390) 7,699 (6,231)
Long-term debt:
Proceeds from issuance 53,227 27,695 11,687
Repayment (25,423) (28,093) (50,555)
Preferred stock:
Proceeds from issuance 3,145 1,377 2,501
Cash dividends paid (1,017) (892) (844)
Common stock:
Proceeds from issuance 2,224 2,091 1,296
Repurchased (5,356) (3,918) (2,416)
Cash dividends paid (5,953) (4,565) (2,537)
Common stock warrants repurchased - (1) (2)
Excess tax benefits related to stock incentive compensation 271 226 79
Net change in noncontrolling interests (296) (611) (331)
Other, net 136 - -
Net cash provided by financing activities 93,910 83,770 24,775
Net change in cash and due from banks (1,941) 2,420 3,396
Cash and due from banks at beginning of year 21,860 19,440 16,044
Cash and due from banks at end of year $ 19,919 21,860 19,440
Supplemental cash flow disclosures:
Cash paid for interest $ 4,321 5,245 7,011
Cash paid for income taxes 7,132 8,024 4,875
The accompanying notes are an integral part of these statements. See Note 1 for noncash activities.
140