Wells Fargo 2013 Annual Report Download - page 168
Download and view the complete annual report
Please find page 168 of the 2013 Wells Fargo annual report below. You can navigate through the pages in the report by either clicking on the pages listed below, or by using the keyword search tool below to find specific information within the annual report.-
 1
1 -
2
-
3
-
4
-
5
-
6
-
7
-
8
-
9
-
10
-
11
-
12
-
13
-
14
-
15
-
16
-
17
-
18
-
19
-
20
-
21
-
22
-
23
-
24
-
25
-
26
-
27
-
28
-
29
-
30
-
31
-
32
-
33
-
34
-
35
-
36
-
37
-
38
-
39
-
40
-
41
-
42
-
43
-
44
-
45
-
46
-
47
-
48
-
49
-
50
-
51
-
52
-
53
-
54
-
55
-
56
-
57
-
58
-
59
-
60
-
61
-
62
-
63
-
64
-
65
-
66
-
67
-
68
-
69
-
70
-
71
-
72
-
73
-
74
-
75
-
76
-
77
-
78
-
79
-
80
-
81
-
82
-
83
-
84
-
85
-
86
-
87
-
88
-
89
-
90
-
91
-
92
-
93
-
94
-
95
-
96
-
97
-
98
-
99
-
100
-
101
-
102
-
103
-
104
-
105
-
106
-
107
-
108
-
109
-
110
-
111
-
112
-
113
-
114
-
115
-
116
-
117
-
118
-
119
-
120
-
121
-
122
-
123
-
124
-
125
-
126
-
127
-
128
-
129
-
130
-
131
-
132
-
133
-
134
-
135
-
136
-
137
-
138
-
139
-
140
-
141
-
142
-
143
-
144
-
145
-
146
-
147
-
148
-
149
-
150
-
151
-
152
-
153
-
154
-
155
-
156
-
157
-
 158
158 -
 159
159 -
 160
160 -
 161
161 -
 162
162 -
 163
163 -
 164
164 -
 165
165 -
 166
166 -
 167
167 -
 168
168 -
 169
169 -
 170
170 -
 171
171 -
 172
172 -
 173
173 -
 174
174 -
 175
175 -
 176
176 -
 177
177 -
 178
178 -
179
-
180
-
181
-
182
-
183
-
184
-
185
-
186
-
187
-
188
-
189
-
190
-
191
-
192
-
193
-
194
-
195
-
196
-
197
-
198
-
199
-
200
-
201
-
202
-
203
-
204
-
205
-
206
-
207
-
208
-
209
-
210
-
211
-
212
-
213
-
214
-
215
-
216
-
217
-
218
-
219
-
220
-
221
-
222
-
223
-
224
-
225
-
226
-
227
-
228
-
229
-
230
-
231
-
232
-
233
-
234
-
235
-
236
-
237
-
238
-
239
-
240
-
241
-
242
-
243
-
244
-
245
-
246
-
247
-
248
-
249
-
250
-
251
-
252
-
253
-
254
-
255
-
256
-
257
-
258
-
259
-
260
-
261
-
262
-
263
-
264
-
265
-
266
-
267
-
268
-
269
-
270
-
271
-
272
 |
 |

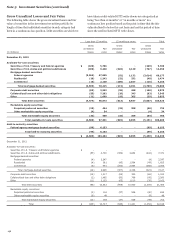
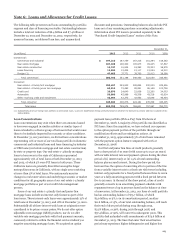
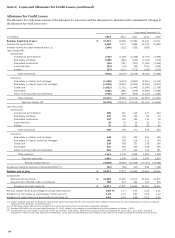
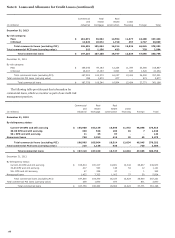
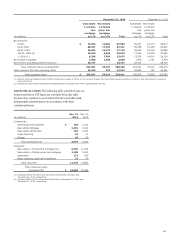
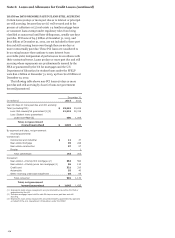
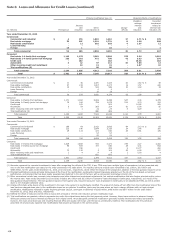
Note 6: Loans and Allowance for Credit Losses (continued)
Allowance for Credit Losses
The allowance for credit losses consists of the allowance for loan losses and the allowance for unfunded credit commitments. Changes in
the allowance for credit losses were:
Year ended December 31,
(in millions) 2013 2012 2011 2010 2009
Balance, beginning of year $ 17,477 19,668 23,463 25,031 21,711
Provision for credit losses 2,309 7,217 7,899 15,753 21,668
Interest income on certain impaired loans (1) (264) (315) (332) (266) -
Loan charge-offs:
Commercial:
Commercial and industrial (715) (1,306) (1,598) (2,775) (3,365)
Real estate mortgage (190) (382) (636) (1,151) (670)
Real estate construction (28) (191) (351) (1,189) (1,063)
Lease financing (33) (24) (38) (120) (229)
Foreign (27) (111) (173) (198) (237)
Total commercial (993) (2,014) (2,796) (5,433) (5,564)
Consumer:
Real estate 1-4 family first mortgage (1,439) (3,013) (3,883) (4,900) (3,318)
Real estate 1-4 family junior lien mortgage (1,578) (3,437) (3,763) (4,934) (4,812)
Credit card (1,022) (1,101) (1,449) (2,396) (2,708)
Automobile (625) (651) (799) (1,308) (2,063)
Other revolving credit and installment (753) (757) (925) (1,129) (1,360)
Total consumer (5,417) (8,959) (10,819) (14,667) (14,261)
Total loan charge-offs (6,410) (10,973) (13,615) (20,100) (19,825)
Loan recoveries:
Commercial:
Commercial and industrial 380 461 419 427 254
Real estate mortgage 227 163 143 68 33
Real estate construction 137 124 146 110 16
Lease financing 16 19 24 20 20
Foreign 27 32 45 53 40
Total commercial 787 799 777 678 363
Consumer:
Real estate 1-4 family first mortgage 245 157 405 522 185
Real estate 1-4 family junior lien mortgage 269 259 218 211 174
Credit card 126 185 251 218 180
Automobile 321 362 439 499 564
Other revolving credit and installment 153 177 226 219 191
Total consumer 1,114 1,140 1,539 1,669 1,294
Total loan recoveries 1,901 1,939 2,316 2,347 1,657
Net loan charge-offs (2) (4,509) (9,034) (11,299) (17,753) (18,168)
Allowances related to business combinations/other (3) (42) (59) (63) 698 (180)
Balance, end of year $ 14,971 17,477 19,668 23,463 25,031
Components:
Allowance for loan losses $ 14,502 17,060 19,372 23,022 24,516
Allowance for unfunded credit commitments 469 417 296 441 515
Allowance for credit losses (4) $ 14,971 17,477 19,668 23,463 25,031
Net loan charge-offs as a percentage of average total loans (2) 0.56 % 1.17 1.49 2.30 2.21
Allowance for loan losses as a percentage of total loans (4) 1.76 2.13 2.52 3.04 3.13
Allowance for credit losses as a percentage of total loans (4) 1.81 2.19 2.56 3.10 3.20
(1) Certain impaired loans with an allowance calculated by discounting expected cash flows using the loan’s effective interest rate over the remaining life of the loan recognize
reductions in the allowance as interest income.
(2) For PCI loans, charge-offs are only recorded to the extent that losses exceed the purchase accounting estimates.
(3) Includes $693 million for the year ended December 31, 2010, related to the adoption of consolidation accounting guidance on January 1, 2010.
(4) The allowance for credit losses includes $30 million, $117 million, $231 million, $298 million and $333 million at December 31, 2013, 2012, 2011, 2010, and 2009,
respectively, related to PCI loans acquired from Wachovia. Loans acquired from Wachovia are included in total loans net of related purchase accounting net write-downs.
166