Wells Fargo 2013 Annual Report Download - page 90
Download and view the complete annual report
Please find page 90 of the 2013 Wells Fargo annual report below. You can navigate through the pages in the report by either clicking on the pages listed below, or by using the keyword search tool below to find specific information within the annual report.-
 1
1 -
2
-
3
-
4
-
5
-
6
-
7
-
8
-
9
-
10
-
11
-
12
-
13
-
14
-
15
-
16
-
17
-
18
-
19
-
20
-
21
-
22
-
23
-
24
-
25
-
26
-
27
-
28
-
29
-
30
-
31
-
32
-
33
-
34
-
35
-
36
-
37
-
38
-
39
-
40
-
41
-
42
-
43
-
44
-
45
-
46
-
47
-
48
-
49
-
50
-
51
-
52
-
53
-
54
-
55
-
56
-
57
-
58
-
59
-
60
-
61
-
62
-
63
-
64
-
65
-
66
-
67
-
68
-
69
-
70
-
71
-
72
-
73
-
74
-
75
-
76
-
77
-
78
-
79
-
 80
80 -
 81
81 -
 82
82 -
 83
83 -
 84
84 -
 85
85 -
 86
86 -
 87
87 -
 88
88 -
 89
89 -
 90
90 -
 91
91 -
 92
92 -
 93
93 -
 94
94 -
 95
95 -
 96
96 -
 97
97 -
 98
98 -
 99
99 -
 100
100 -
101
-
102
-
103
-
104
-
105
-
106
-
107
-
108
-
109
-
110
-
111
-
112
-
113
-
114
-
115
-
116
-
117
-
118
-
119
-
120
-
121
-
122
-
123
-
124
-
125
-
126
-
127
-
128
-
129
-
130
-
131
-
132
-
133
-
134
-
135
-
136
-
137
-
138
-
139
-
140
-
141
-
142
-
143
-
144
-
145
-
146
-
147
-
148
-
149
-
150
-
151
-
152
-
153
-
154
-
155
-
156
-
157
-
158
-
159
-
160
-
161
-
162
-
163
-
164
-
165
-
166
-
167
-
168
-
169
-
170
-
171
-
172
-
173
-
174
-
175
-
176
-
177
-
178
-
179
-
180
-
181
-
182
-
183
-
184
-
185
-
186
-
187
-
188
-
189
-
190
-
191
-
192
-
193
-
194
-
195
-
196
-
197
-
198
-
199
-
200
-
201
-
202
-
203
-
204
-
205
-
206
-
207
-
208
-
209
-
210
-
211
-
212
-
213
-
214
-
215
-
216
-
217
-
218
-
219
-
220
-
221
-
222
-
223
-
224
-
225
-
226
-
227
-
228
-
229
-
230
-
231
-
232
-
233
-
234
-
235
-
236
-
237
-
238
-
239
-
240
-
241
-
242
-
243
-
244
-
245
-
246
-
247
-
248
-
249
-
250
-
251
-
252
-
253
-
254
-
255
-
256
-
257
-
258
-
259
-
260
-
261
-
262
-
263
-
264
-
265
-
266
-
267
-
268
-
269
-
270
-
271
-
272
 |
 |

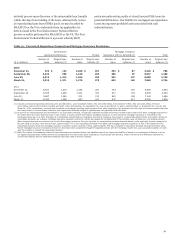
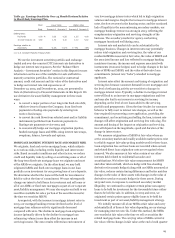
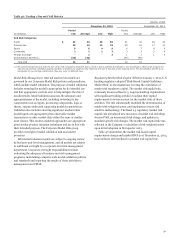
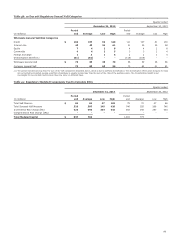
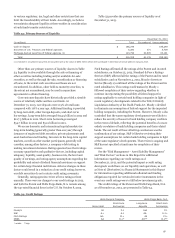
Table 43 presents total revenue from trading activities.
Table 43: Income from Trading Activities
Year ended December 31,
(in millions) 2013 2012 2011
Interest income (1) $ 1,376 1,358 1,440
Less: Interest expense (2) 307 245 316
Net interest income 1,069 1,113 1,124
Noninterest income:
Net gains (losses) from
trading activities (3):
Customer accommodation 1,278 1,347 1,029
Economic hedges and other (4) 332 345 (1)
Proprietary trading 13 15 (14)
Total net trading gains 1,623 1,707 1,014
Total trading-related net interest
and noninterest income $ 2,692 2,820 2,138
(1) Represents interest and dividend income earned on trading securities.
(2) Represents interest and dividend expense incurred on trading securities we have
sold but have not yet purchased.
(3) Represents realized gains (losses) from our trading activity and unrealized gains
(losses) due to changes in fair value of our trading positions, attributable to the
type of business activity.
(4) Excludes economic hedging of mortgage banking activities and asset/liability
management.
Customer accommodation Customer accommodation activities
are conducted to help customers manage their investment needs
and risk management and hedging activities. We engage in
market-making activities or act as an intermediary to purchase
or sell financial instruments in anticipation of or in response to
customer needs. This category also includes positions we use to
manage our exposure to such transactions.
For the majority of our customer accommodation trading, we
serve as intermediary between buyer and seller. For example, we
may purchase or sell a derivative to a customer who wants to
manage interest rate risk exposure. We typically enter into
offsetting derivative or security positions with a separate
counterparty or exchange to manage our exposure to the
derivative with our customer. We earn income on this activity
based on the transaction price difference between the customer
and offsetting derivative or security positions, which is reflected
in the fair value changes of the positions recorded in net gains
(losses) on trading activities.
Customer accommodation trading also includes net gains
related to market-making activities in which we take positions to
facilitate customer order flow. For example, we may own
securities recorded as trading assets (long positions) or sold
securities we have not yet purchased, recorded as trading
liabilities (short positions), typically on a short-term basis, to
facilitate anticipated buying and selling demand from our
customers. As market-maker in these securities, we earn income
due (1) to the difference between the price paid or received for
the purchase and sale of the security (bid-ask spread) and (2) the
net interest income and change in fair value of the long or short
positions during the short-term period held on our balance
sheet. Additionally, we may enter into separate derivative or
security positions to manage our exposure related to our long or
short security positions. Collectively, income earned on this type
of market-making activity is reflected in the fair value changes of
these positions recorded in net gain (losses) on trading activities.
Economic hedges and other Economic hedges in trading are not
designated in a hedge accounting relationship and exclude
economic hedging related to our asset/liability risk management
and substantially all mortgage banking risk management
activities. Economic hedging activities include the use of trading
securities to economically hedge risk exposures related to non-
trading activities or derivatives to hedge risk exposures related
to trading assets or trading liabilities. Economic hedges are
unrelated to our customer accommodation activities. Other
activities include financial assets held for investment purposes
that we elected to carry at fair value with changes in fair value
recorded to earnings in order to mitigate accounting
measurement mismatches or avoid embedded derivative
accounting complexities.
Proprietary trading Proprietary trading consists of security or
derivative positions executed for our own account based upon
market expectations or to benefit from price differences between
financial instruments and markets. Proprietary trading activity
has been substantially restricted by the Dodd-Frank Act
provisions known as the “Volcker Rule.” On December 10, 2013,
federal banking regulators, the SEC and CFTC jointly released a
final rule to implement the Volcker Rule’s restrictions. Banking
entities are not required to come into compliance with the
Volcker Rule’s restrictions until July 21, 2015, however, we will
be required to report certain trading metrics beginning
June 30, 2014. During the conformance period, banking entities
are expected to engage in “good faith” planning efforts,
appropriate for their activities and investments, to enable them
to conform all of their activities and investments to the Volcker
Rule’s restrictions by no later than July 21, 2015. Accordingly, we
reduced and are exiting certain business activities in anticipation
of the final Volcker Rule. As discussed within this section and
the noninterest income section of our financial results,
proprietary trading activity is insignificant to our business and
financial results. For more details on the Volcker Rule, see the
“Regulatory Reform” section in this Report.
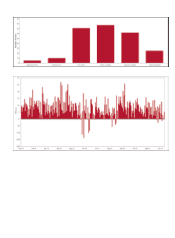
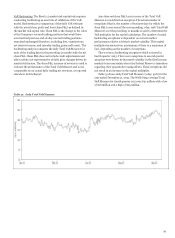
Daily Trading Revenue Table 44 and Table 45 provide
information on daily trading-related revenues for the Company’s
trading portfolio. This trading-related revenue is defined as the
change in value of the trading assets and trading liabilities,
trading-related net interest income and trading-related intra-day
gains and losses. Net trading-related revenue does not include
activity related to long-term positions held for economic hedging
purposes, period-end adjustments and other activity not
representative of daily price changes driven by market factors.
Risk Management – Asset/Liability Management (continued)
88