Wells Fargo 2013 Annual Report Download - page 223
Download and view the complete annual report
Please find page 223 of the 2013 Wells Fargo annual report below. You can navigate through the pages in the report by either clicking on the pages listed below, or by using the keyword search tool below to find specific information within the annual report.-
 1
1 -
2
-
3
-
4
-
5
-
6
-
7
-
8
-
9
-
10
-
11
-
12
-
13
-
14
-
15
-
16
-
17
-
18
-
19
-
20
-
21
-
22
-
23
-
24
-
25
-
26
-
27
-
28
-
29
-
30
-
31
-
32
-
33
-
34
-
35
-
36
-
37
-
38
-
39
-
40
-
41
-
42
-
43
-
44
-
45
-
46
-
47
-
48
-
49
-
50
-
51
-
52
-
53
-
54
-
55
-
56
-
57
-
58
-
59
-
60
-
61
-
62
-
63
-
64
-
65
-
66
-
67
-
68
-
69
-
70
-
71
-
72
-
73
-
74
-
75
-
76
-
77
-
78
-
79
-
80
-
81
-
82
-
83
-
84
-
85
-
86
-
87
-
88
-
89
-
90
-
91
-
92
-
93
-
94
-
95
-
96
-
97
-
98
-
99
-
100
-
101
-
102
-
103
-
104
-
105
-
106
-
107
-
108
-
109
-
110
-
111
-
112
-
113
-
114
-
115
-
116
-
117
-
118
-
119
-
120
-
121
-
122
-
123
-
124
-
125
-
126
-
127
-
128
-
129
-
130
-
131
-
132
-
133
-
134
-
135
-
136
-
137
-
138
-
139
-
140
-
141
-
142
-
143
-
144
-
145
-
146
-
147
-
148
-
149
-
150
-
151
-
152
-
153
-
154
-
155
-
156
-
157
-
158
-
159
-
160
-
161
-
162
-
163
-
164
-
165
-
166
-
167
-
168
-
169
-
170
-
171
-
172
-
173
-
174
-
175
-
176
-
177
-
178
-
179
-
180
-
181
-
182
-
183
-
184
-
185
-
186
-
187
-
188
-
189
-
190
-
191
-
192
-
193
-
194
-
195
-
196
-
197
-
198
-
199
-
200
-
201
-
202
-
203
-
204
-
205
-
206
-
207
-
208
-
209
-
210
-
211
-
212
-
 213
213 -
 214
214 -
 215
215 -
 216
216 -
 217
217 -
 218
218 -
 219
219 -
 220
220 -
 221
221 -
 222
222 -
 223
223 -
 224
224 -
 225
225 -
 226
226 -
 227
227 -
 228
228 -
 229
229 -
 230
230 -
 231
231 -
 232
232 -
 233
233 -
234
-
235
-
236
-
237
-
238
-
239
-
240
-
241
-
242
-
243
-
244
-
245
-
246
-
247
-
248
-
249
-
250
-
251
-
252
-
253
-
254
-
255
-
256
-
257
-
258
-
259
-
260
-
261
-
262
-
263
-
264
-
265
-
266
-
267
-
268
-
269
-
270
-
271
-
272
 |
 |

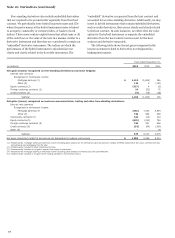
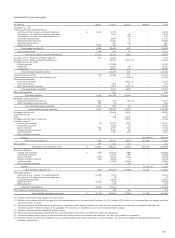
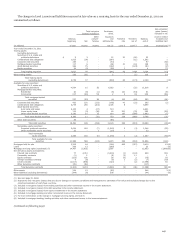
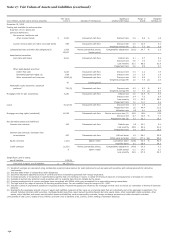
(continued from previous page)
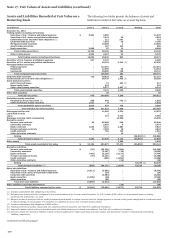
(in millions) Level 1 Level 2 Level 3 Netting Total
--
- -
- - -
- -
- -
- -
-
-
-
-
--
- -
- - -
--
--
- -
-
- - -
- -
- -
- -
- -
- - -
-
-
--
-
-
-
-
-
- -
-
-
-
-
-
-
- -
-
-
- -
- - - - -
- - -
-
-
- -
-
-
- -
- - -
- - -
- -
- - -
- - -
- -
- - -
- -
- -
$
$
$
$
December 31, 2012
Trading assets (excluding derivatives)
Securities of U.S. Treasury and federal agencies 5,104 3,774 8,878
Securities of U.S. states and political subdivisions 1,587 46 1,633
Collateralized loan and other debt obligations (1) 742 742
Corporate debt securities 6,664 52 6,716
Mortgage-backed securities 13,380 6 13,386
Asset-backed securities 722 138 860
Equity securities 3,481 356 3 3,840
Total trading securities(2) 8,585 26,483 987 36,055
Other trading assets 2,150 887 76 3,113
Total trading assets (excluding derivatives) 10,735 27,370 1,063 39,168
Securities of U.S. Treasury and federal agencies 915 6,231 7,146
Securities of U.S. states and political subdivisions 35,045 3,631 (3) 38,676
Mortgage-backed securities:
Federal agencies 97,285 97,285
Residential 15,837 94 15,931
Commercial 19,765 203 19,968
Total mortgage-backed securities 132,887 297 133,184
Corporate debt securities 125 20,934 274 21,333
Collateralized loan and other debt obligations (4) 13,188 (3) 13,188
Asset-backed securities:
Auto loans and leases 7 5,921 (3) 5,928
Home equity loans 867 51 918
Other asset-backed securities 7,828 3,283 (3) 11,111
Total asset-backed securities 8,702 9,255 17,957
Other debt securities 930 930
Total debt securities 1,040 204,729 26,645 232,414
Marketable equity securities:
Perpetual preferred securities (5) 629 753 794 (3) 2,176
Other marketable equity securities 554 55 609
Total marketable equity securities 1,183 808 794 2,785
Total available-for-sale securities 2,223 205,537 27,439 235,199
Mortgages held for sale 39,055 3,250 42,305
Loans held for sale 6 6
Loans 185 6,021 6,206
Mortgage servicing rights (residential) 11,538 11,538
Derivative assets:
Interest rate contracts 16 70,277 1,058 71,351
Commodity contracts 3,386 70 3,456
Equity contracts 432 2,747 604 3,783
Foreign exchange contracts 19 5,481 24 5,524
Credit contracts 1,160 650 1,810
Other derivative contracts
Netting (62,108) (6) (62,108)
Total derivative assets (7) 467 83,051 2,406 (62,108) 23,816
Other assets 136 123 162 421
Total assets recorded at fair value 13,561 355,327 51,879 (62,108) 358,659
Derivative liabilities:
Interest rate contracts (52) (68,244) (399) (68,695)
Commodity contracts (3,541) (49) (3,590)
Equity contracts (199) (3,239) (726) (4,164)
Foreign exchange contracts (23) (3,553) (3) (3,579)
Credit contracts (1,152) (1,800) (2,952)
Other derivative contracts (78) (78)
Netting 71,116 (6) 71,116
Total derivative liabilities (7) (274) (79,729) (3,055) 71,116 (11,942)
Short sale liabilities:
Securities of U.S. Treasury and federal agencies (4,225) (875) (5,100)
Securities of U.S. states and political subdivisions (9) (9)
Corporate debt securities (3,941) (3,941)
Equity securities (1,233) (35) (1,268)
Other securities (47) (47)
Total short sale liabilities (5,458) (4,907) (10,365)
Other liabilities (excluding derivatives) (34) (49) (83)
Total liabilities recorded at fair value (5,732) (84,670) (3,104) 71,116 (22,390)
(1) Includes collateralized debt obligations of $21 million.
(2) Net gains from trading activities recognized in the income statement for the year ended December 31, 2012 include $305 million in net unrealized gains on trading securities
held at December 31, 2012.
(3) Balances consist of securities that are predominantly investment grade based on ratings received from the ratings agencies or internal credit grades categorized as
investment grade if external ratings are not available. The securities are classified as Level 3 due to limited market activity.
(4) Includes collateralized debt obligations of $644 million.
(5) Perpetual preferred securities include ARS and corporate preferred securities. See Note 8 for additional information.
(6) Represents balance sheet netting of derivative asset and liability balances and related cash collateral. See Note 16 for additional information.
(7) Derivative assets and derivative liabilities include contracts qualifying for hedge accounting, economic hedges, and derivatives included in trading assets and trading
liabilities, respectively.
221