Wells Fargo 2013 Annual Report Download - page 253
Download and view the complete annual report
Please find page 253 of the 2013 Wells Fargo annual report below. You can navigate through the pages in the report by either clicking on the pages listed below, or by using the keyword search tool below to find specific information within the annual report.-
 1
1 -
2
-
3
-
4
-
5
-
6
-
7
-
8
-
9
-
10
-
11
-
12
-
13
-
14
-
15
-
16
-
17
-
18
-
19
-
20
-
21
-
22
-
23
-
24
-
25
-
26
-
27
-
28
-
29
-
30
-
31
-
32
-
33
-
34
-
35
-
36
-
37
-
38
-
39
-
40
-
41
-
42
-
43
-
44
-
45
-
46
-
47
-
48
-
49
-
50
-
51
-
52
-
53
-
54
-
55
-
56
-
57
-
58
-
59
-
60
-
61
-
62
-
63
-
64
-
65
-
66
-
67
-
68
-
69
-
70
-
71
-
72
-
73
-
74
-
75
-
76
-
77
-
78
-
79
-
80
-
81
-
82
-
83
-
84
-
85
-
86
-
87
-
88
-
89
-
90
-
91
-
92
-
93
-
94
-
95
-
96
-
97
-
98
-
99
-
100
-
101
-
102
-
103
-
104
-
105
-
106
-
107
-
108
-
109
-
110
-
111
-
112
-
113
-
114
-
115
-
116
-
117
-
118
-
119
-
120
-
121
-
122
-
123
-
124
-
125
-
126
-
127
-
128
-
129
-
130
-
131
-
132
-
133
-
134
-
135
-
136
-
137
-
138
-
139
-
140
-
141
-
142
-
143
-
144
-
145
-
146
-
147
-
148
-
149
-
150
-
151
-
152
-
153
-
154
-
155
-
156
-
157
-
158
-
159
-
160
-
161
-
162
-
163
-
164
-
165
-
166
-
167
-
168
-
169
-
170
-
171
-
172
-
173
-
174
-
175
-
176
-
177
-
178
-
179
-
180
-
181
-
182
-
183
-
184
-
185
-
186
-
187
-
188
-
189
-
190
-
191
-
192
-
193
-
194
-
195
-
196
-
197
-
198
-
199
-
200
-
201
-
202
-
203
-
204
-
205
-
206
-
207
-
208
-
209
-
210
-
211
-
212
-
213
-
214
-
215
-
216
-
217
-
218
-
219
-
220
-
221
-
222
-
223
-
224
-
225
-
226
-
227
-
228
-
229
-
230
-
231
-
232
-
233
-
234
-
235
-
236
-
237
-
238
-
239
-
240
-
241
-
242
-
 243
243 -
 244
244 -
 245
245 -
 246
246 -
 247
247 -
 248
248 -
 249
249 -
 250
250 -
 251
251 -
 252
252 -
 253
253 -
 254
254 -
 255
255 -
 256
256 -
 257
257 -
 258
258 -
 259
259 -
 260
260 -
 261
261 -
 262
262 -
 263
263 -
264
-
265
-
266
-
267
-
268
-
269
-
270
-
271
-
272
 |
 |

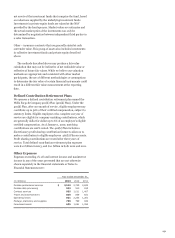
net assets of the investment funds that comprise the fund, based
on valuations supplied by the underlying investment funds.
Investments in private equity funds are valued at the NAV
provided by the fund sponsor. Market values are estimates and
the actual market price of the investments can only be
determined by negotiation between independent third parties in
a sales transaction.
Other – insurance contracts that are generally stated at cash
surrender value. This group of assets also includes investments
in collective investment funds and private equity described
above.
The methods described above may produce a fair value
calculation that may not be indicative of net realizable value or
reflective of future fair values. While we believe our valuation
methods are appropriate and consistent with other market
participants, the use of different methodologies or assumptions
to determine the fair value of certain financial instruments could
result in a different fair value measurement at the reporting
date.
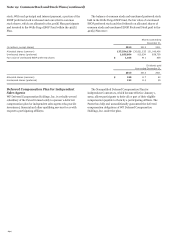
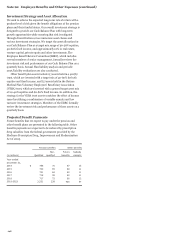
Defined Contribution Retirement Plans
We sponsor a defined contribution retirement plan named the
Wells Fargo & Company 401(k) Plan (401(k) Plan). Under the
401(k) Plan, after one month of service, eligible employees may
contribute up to 50% of their certified compensation, subject to
statutory limits. Eligible employees who complete one year of
service are eligible for company matching contributions, which
are generally dollar for dollar up to 6% of an employee's eligible
certified compensation. As of January 1, 2010, matching
contributions are 100% vested. The 401(k) Plan includes a
discretionary profit sharing contribution feature to allow us to
make a contribution to eligible employees’ 401(k) Plan accounts.
Profit sharing contributions are vested after three years of
service. Total defined contribution retirement plan expenses
were $1.2 billion in 2013, and $1.1 billion in both 2012 and 2011.
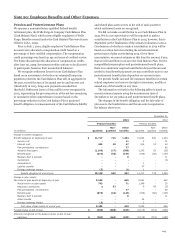
Other Expenses
Expenses exceeding 1% of total interest income and noninterest
income in any of the years presented that are not otherwise
shown separately in the financial statements or Notes to
Financial Statements were:
Year ended December 31,
(in millions) 2013 2012 2011
Outside professional services $ 2,519 2,729 2,692
Outside data processing 983 910 935
Contract services 935 1,011 1,407
Travel and entertainment 885 839 821
Operating losses 821 2,235 1,261
Postage, stationery and supplies 756 799 942
Foreclosed assets 605 1,061 1,354
251