Wells Fargo 2013 Annual Report Download - page 236
Download and view the complete annual report
Please find page 236 of the 2013 Wells Fargo annual report below. You can navigate through the pages in the report by either clicking on the pages listed below, or by using the keyword search tool below to find specific information within the annual report.-
 1
1 -
2
-
3
-
4
-
5
-
6
-
7
-
8
-
9
-
10
-
11
-
12
-
13
-
14
-
15
-
16
-
17
-
18
-
19
-
20
-
21
-
22
-
23
-
24
-
25
-
26
-
27
-
28
-
29
-
30
-
31
-
32
-
33
-
34
-
35
-
36
-
37
-
38
-
39
-
40
-
41
-
42
-
43
-
44
-
45
-
46
-
47
-
48
-
49
-
50
-
51
-
52
-
53
-
54
-
55
-
56
-
57
-
58
-
59
-
60
-
61
-
62
-
63
-
64
-
65
-
66
-
67
-
68
-
69
-
70
-
71
-
72
-
73
-
74
-
75
-
76
-
77
-
78
-
79
-
80
-
81
-
82
-
83
-
84
-
85
-
86
-
87
-
88
-
89
-
90
-
91
-
92
-
93
-
94
-
95
-
96
-
97
-
98
-
99
-
100
-
101
-
102
-
103
-
104
-
105
-
106
-
107
-
108
-
109
-
110
-
111
-
112
-
113
-
114
-
115
-
116
-
117
-
118
-
119
-
120
-
121
-
122
-
123
-
124
-
125
-
126
-
127
-
128
-
129
-
130
-
131
-
132
-
133
-
134
-
135
-
136
-
137
-
138
-
139
-
140
-
141
-
142
-
143
-
144
-
145
-
146
-
147
-
148
-
149
-
150
-
151
-
152
-
153
-
154
-
155
-
156
-
157
-
158
-
159
-
160
-
161
-
162
-
163
-
164
-
165
-
166
-
167
-
168
-
169
-
170
-
171
-
172
-
173
-
174
-
175
-
176
-
177
-
178
-
179
-
180
-
181
-
182
-
183
-
184
-
185
-
186
-
187
-
188
-
189
-
190
-
191
-
192
-
193
-
194
-
195
-
196
-
197
-
198
-
199
-
200
-
201
-
202
-
203
-
204
-
205
-
206
-
207
-
208
-
209
-
210
-
211
-
212
-
213
-
214
-
215
-
216
-
217
-
218
-
219
-
220
-
221
-
222
-
223
-
224
-
225
-
 226
226 -
 227
227 -
 228
228 -
 229
229 -
 230
230 -
 231
231 -
 232
232 -
 233
233 -
 234
234 -
 235
235 -
 236
236 -
 237
237 -
 238
238 -
 239
239 -
 240
240 -
 241
241 -
 242
242 -
 243
243 -
 244
244 -
 245
245 -
 246
246 -
247
-
248
-
249
-
250
-
251
-
252
-
253
-
254
-
255
-
256
-
257
-
258
-
259
-
260
-
261
-
262
-
263
-
264
-
265
-
266
-
267
-
268
-
269
-
270
-
271
-
272
 |
 |

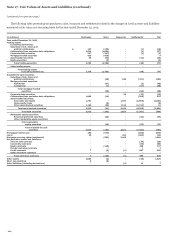
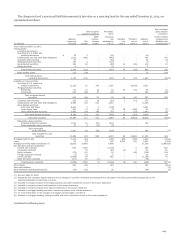
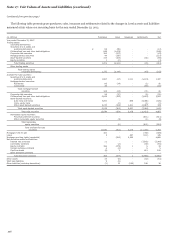
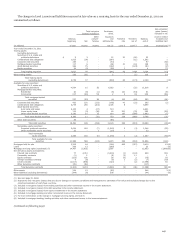
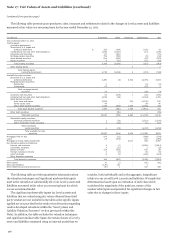
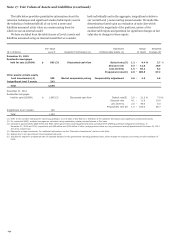
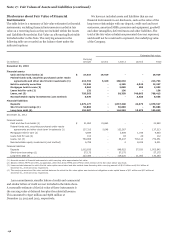
Note 17: Fair Values of Assets and Liabilities (continued)
The table below provides quantitative information about the
valuation techniques and significant unobservable inputs used in
the valuation of substantially all of our Level 3 assets and
liabilities measured at fair value on a nonrecurring basis for
which we use an internal model.
We have excluded from the table classes of Level 3 assets and
liabilities measured using an internal model that we consider,
both individually and in the aggregate, insignificant relative to
our overall Level 3 nonrecurring measurements. We made this
determination based upon an evaluation of each class which
considered the magnitude of the positions, nature of the
unobservable inputs and potential for significant changes in fair
value due to changes in those inputs.
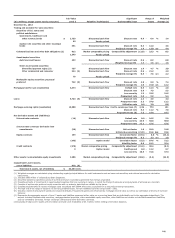
($ in millions)
Fair Value
Level 3 Valuation Technique(s) (1)
Significant
Unobservable Inputs (1)
Range
of inputs
Weighted
Average (2)
December 31, 2013
Residential mortgages
held for sale (LOCOM) $ 893 (3) Discounted cash flow Default rate (5)
1.2 -4.4 % 2.7 %
Discount rate 4.3 -12.0 10.9
Loss severity 1.6 -48.2 5.2
Prepayment rate (6) 2.0 -100.0 67.2
Other assets: private equity
fund investments (4) 505 Market comparable pricing Comparability adjustment 4.6 -4.6 4.6
Insignificant level 3 assets 242
Total 1,640
December 31, 2012
Residential mortgages
held for sale (LOCOM) $ 1,045 (3) Discounted cash flow Default rate(5) 2.9 -21.2 % 7.9 %
Discount rate 4.1 -11.9 10.9
Loss severity 2.0 -45.0 6.0
Prepayment rate (6) 1.0 -100.0 66.7
Insignificant level 3 assets 148
Total 1,193
234
(1) Refer to the narrative following the recurring quantitative Level 3 table of this Note for a definition of the valuation technique(s) and significant unobservable inputs.
(2) For residential MHFS, weighted averages are calculated using outstanding unpaid principal balance of the loans.
(3) Consists of approximately $825 million and $942 million government insured/guaranteed loans purchased from GNMA-guaranteed mortgage securitization, at
December 31, 2013 and 2012, respectively and $68 million and $103 million of other mortgage loans which are not government insured/guaranteed at December 31, 2013
and 2012, respectively.
(4) Represents a single investment. For additional information, see the “Alternative Investments” section in this Note.
(5) Applies only to non-government insured/guaranteed loans.
(6) Includes the impact on prepayment rate of expected defaults for the government insured/guaranteed loans, which impacts the frequency and timing of early resolution of
loans.