Wells Fargo 2013 Annual Report Download - page 66
Download and view the complete annual report
Please find page 66 of the 2013 Wells Fargo annual report below. You can navigate through the pages in the report by either clicking on the pages listed below, or by using the keyword search tool below to find specific information within the annual report.-
 1
1 -
2
-
3
-
4
-
5
-
6
-
7
-
8
-
9
-
10
-
11
-
12
-
13
-
14
-
15
-
16
-
17
-
18
-
19
-
20
-
21
-
22
-
23
-
24
-
25
-
26
-
27
-
28
-
29
-
30
-
31
-
32
-
33
-
34
-
35
-
36
-
37
-
38
-
39
-
40
-
41
-
42
-
43
-
44
-
45
-
46
-
47
-
48
-
49
-
50
-
51
-
52
-
53
-
54
-
55
-
 56
56 -
 57
57 -
 58
58 -
 59
59 -
 60
60 -
 61
61 -
 62
62 -
 63
63 -
 64
64 -
 65
65 -
 66
66 -
 67
67 -
 68
68 -
 69
69 -
 70
70 -
 71
71 -
 72
72 -
 73
73 -
 74
74 -
 75
75 -
 76
76 -
77
-
78
-
79
-
80
-
81
-
82
-
83
-
84
-
85
-
86
-
87
-
88
-
89
-
90
-
91
-
92
-
93
-
94
-
95
-
96
-
97
-
98
-
99
-
100
-
101
-
102
-
103
-
104
-
105
-
106
-
107
-
108
-
109
-
110
-
111
-
112
-
113
-
114
-
115
-
116
-
117
-
118
-
119
-
120
-
121
-
122
-
123
-
124
-
125
-
126
-
127
-
128
-
129
-
130
-
131
-
132
-
133
-
134
-
135
-
136
-
137
-
138
-
139
-
140
-
141
-
142
-
143
-
144
-
145
-
146
-
147
-
148
-
149
-
150
-
151
-
152
-
153
-
154
-
155
-
156
-
157
-
158
-
159
-
160
-
161
-
162
-
163
-
164
-
165
-
166
-
167
-
168
-
169
-
170
-
171
-
172
-
173
-
174
-
175
-
176
-
177
-
178
-
179
-
180
-
181
-
182
-
183
-
184
-
185
-
186
-
187
-
188
-
189
-
190
-
191
-
192
-
193
-
194
-
195
-
196
-
197
-
198
-
199
-
200
-
201
-
202
-
203
-
204
-
205
-
206
-
207
-
208
-
209
-
210
-
211
-
212
-
213
-
214
-
215
-
216
-
217
-
218
-
219
-
220
-
221
-
222
-
223
-
224
-
225
-
226
-
227
-
228
-
229
-
230
-
231
-
232
-
233
-
234
-
235
-
236
-
237
-
238
-
239
-
240
-
241
-
242
-
243
-
244
-
245
-
246
-
247
-
248
-
249
-
250
-
251
-
252
-
253
-
254
-
255
-
256
-
257
-
258
-
259
-
260
-
261
-
262
-
263
-
264
-
265
-
266
-
267
-
268
-
269
-
270
-
271
-
272
 |
 |

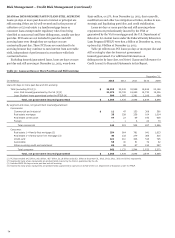
Risk Management – Credit Risk Management (continued)
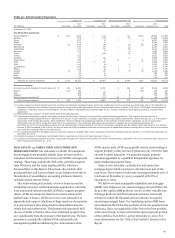
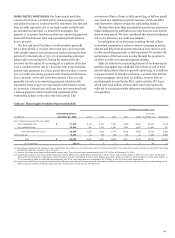
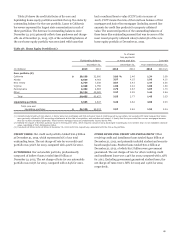
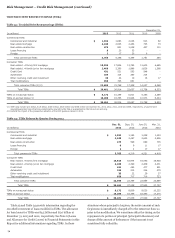
Table 25: Pick-a-Pay Portfolio (1)
December 31, 2013
PCI loans All other loans
(in millions)
Adjusted
unpaid
principal
balance (2)
Current
LTV
ratio (3)
Carrying
value (4)
Ratio of
carrying
value to
current
value (5)
Carrying
value (4)
Ratio of
carrying
value to
current
value (5)
California $ 19,797 89 % $ 16,213 72 % $ 13,219 65 %
Florida 2,395 98 1,827 69 2,764 80
New Jersey 1,029 87 974 74 1,770 74
New York 609 84 592 73 797 73
Texas 266 70 241 62 1,081 56
Other states 4,704 89 4,001 74 7,492 75
Total Pick-a-Pay loans $ 28,800 $ 23,848 $ 27,123
(1) The individual states shown in this table represent the top five states based on the total net carrying value of the Pick-a-Pay loans at the beginning of 2013.
(2) Adjusted unpaid principal balance includes write-downs taken on loans where severe delinquency (normally 180 days) or other indications of severe borrower financial stress
exist that indicate there will be a loss of contractually due amounts upon final resolution of the loan.
(3) The current LTV ratio is calculated as the adjusted unpaid principal balance divided by the collateral value. Collateral values are generally determined using automated
valuation models (AVM) and are updated quarterly. AVMs are computer-based tools used to estimate market values of homes based on processing large volumes of market
data including market comparables and price trends for local market areas.
(4) Carrying value, which does not reflect the allowance for loan losses, includes remaining purchase accounting adjustments, which, for PCI loans may include the
nonaccretable difference and the accretable yield and, for all other loans, an adjustment to mark the loans to a market yield at date of merger less any subsequent charge-
offs.
(5) The ratio of carrying value to current value is calculated as the carrying value divided by the collateral value.
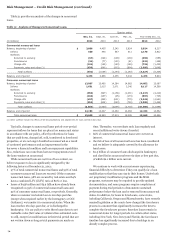
To maximize return and allow flexibility for customers to
avoid foreclosure, we have in place several loss mitigation
strategies for our Pick-a-Pay loan portfolio. We contact
customers who are experiencing financial difficulty and may in
certain cases modify the terms of a loan based on a customer’s
documented income and other circumstances.
We also have taken steps to work with customers to refinance
or restructure their Pick-a-Pay loans into other loan products.
For customers at risk, we offer combinations of term extensions
of up to 40 years (from 30 years), interest rate reductions,
forbearance of principal, and, in geographies with substantial
property value declines, we may offer permanent principal
forgiveness.
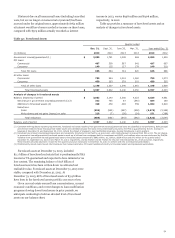
In 2013, we completed more than 11,800 proprietary and
Home Affordability Modification Program (HAMP) Pick-a-Pay
loan modifications. We have completed more than 123,000
modifications since the Wachovia acquisition, resulting in
$5.8 billion of principal forgiveness to our Pick-a-Pay customers
as well as an additional $229 million of conditional forgiveness
that can be earned by borrowers through performance over a
three year period.
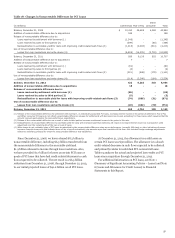
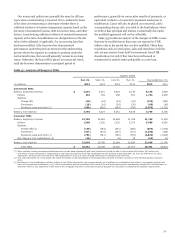
Due to better than expected performance observed on the
Pick-a-Pay PCI portfolio compared with the original acquisition
estimates, we have reclassified $3.9 billion from the
nonaccretable difference to the accretable yield since acquisition,
including $866 million in 2013. Our cash flows expected to be
collected have been favorably affected by lower expected defaults
and losses as a result of observed and forecasted economic
strengthening, particularly in housing prices, and our loan
modification efforts. These factors are expected to reduce the
frequency and severity of defaults and keep these loans
performing for a longer period, thus increasing future principal
and interest cash flows. The resulting increase in the accretable
yield will be realized over the remaining life of the portfolio,
which is estimated to have a weighted-average remaining life of
approximately 12.7 years at December 31, 2013. The accretable
yield percentage at December 31, 2013 was 4.98%, up from
4.70% at the end of 2012 due to increased cash flows from
improved economic outlook and credit trends. Fluctuations in
the accretable yield are driven by changes in interest rate indices
for variable rate PCI loans, prepayment assumptions, and
expected principal and interest payments over the estimated life
of the portfolio, which will be affected by the pace and degree of
improvements in the U.S. economy and housing markets and
projected lifetime performance resulting from loan modification
activity. Changes in the projected timing of cash flow events,
including loan liquidations, modifications and short sales, can
also affect the accretable yield rate and the estimated weighted-
average life of the portfolio.
The Pick-a-Pay portfolio includes a significant portion of our
PCI loans. For further information on the judgment involved in
estimating expected cash flows for PCI loans, see the “Critical
Accounting Policies – Purchased Credit-Impaired Loans” section
and Note 1 (Summary of Significant Accounting Policies) to
Financial Statements in this Report.
64