Wells Fargo 2013 Annual Report Download - page 34
Download and view the complete annual report
Please find page 34 of the 2013 Wells Fargo annual report below. You can navigate through the pages in the report by either clicking on the pages listed below, or by using the keyword search tool below to find specific information within the annual report.-
 1
1 -
2
-
3
-
4
-
5
-
6
-
7
-
8
-
9
-
10
-
11
-
12
-
13
-
14
-
15
-
16
-
17
-
18
-
19
-
20
-
21
-
22
-
23
-
 24
24 -
 25
25 -
 26
26 -
 27
27 -
 28
28 -
 29
29 -
 30
30 -
 31
31 -
 32
32 -
 33
33 -
 34
34 -
 35
35 -
 36
36 -
 37
37 -
 38
38 -
 39
39 -
 40
40 -
 41
41 -
 42
42 -
 43
43 -
 44
44 -
45
-
46
-
47
-
48
-
49
-
50
-
51
-
52
-
53
-
54
-
55
-
56
-
57
-
58
-
59
-
60
-
61
-
62
-
63
-
64
-
65
-
66
-
67
-
68
-
69
-
70
-
71
-
72
-
73
-
74
-
75
-
76
-
77
-
78
-
79
-
80
-
81
-
82
-
83
-
84
-
85
-
86
-
87
-
88
-
89
-
90
-
91
-
92
-
93
-
94
-
95
-
96
-
97
-
98
-
99
-
100
-
101
-
102
-
103
-
104
-
105
-
106
-
107
-
108
-
109
-
110
-
111
-
112
-
113
-
114
-
115
-
116
-
117
-
118
-
119
-
120
-
121
-
122
-
123
-
124
-
125
-
126
-
127
-
128
-
129
-
130
-
131
-
132
-
133
-
134
-
135
-
136
-
137
-
138
-
139
-
140
-
141
-
142
-
143
-
144
-
145
-
146
-
147
-
148
-
149
-
150
-
151
-
152
-
153
-
154
-
155
-
156
-
157
-
158
-
159
-
160
-
161
-
162
-
163
-
164
-
165
-
166
-
167
-
168
-
169
-
170
-
171
-
172
-
173
-
174
-
175
-
176
-
177
-
178
-
179
-
180
-
181
-
182
-
183
-
184
-
185
-
186
-
187
-
188
-
189
-
190
-
191
-
192
-
193
-
194
-
195
-
196
-
197
-
198
-
199
-
200
-
201
-
202
-
203
-
204
-
205
-
206
-
207
-
208
-
209
-
210
-
211
-
212
-
213
-
214
-
215
-
216
-
217
-
218
-
219
-
220
-
221
-
222
-
223
-
224
-
225
-
226
-
227
-
228
-
229
-
230
-
231
-
232
-
233
-
234
-
235
-
236
-
237
-
238
-
239
-
240
-
241
-
242
-
243
-
244
-
245
-
246
-
247
-
248
-
249
-
250
-
251
-
252
-
253
-
254
-
255
-
256
-
257
-
258
-
259
-
260
-
261
-
262
-
263
-
264
-
265
-
266
-
267
-
268
-
269
-
270
-
271
-
272
 |
 |

Overview (continued)
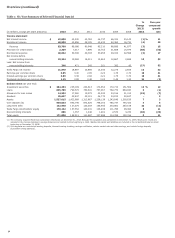
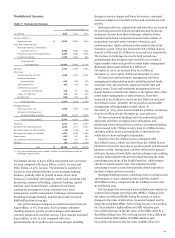
Table 1: Six-Year Summary of Selected Financial Data (1)
(in millions, except per share amounts) 2013 2012 2011 2010 2009 2008
%
Change
2013/
2012
Five-year
compound
growth
rate
Income statement
Net interest income $ 42,800 43,230 42,763 44,757 46,324 25,143 (1) % 11
Noninterest income 40,980 42,856 38,185 40,453 42,362 16,734 (4) 20
Revenue 83,780 86,086 80,948 85,210 88,686 41,877 (3) 15
Provision for credit losses 2,309 7,217 7,899 15,753 21,668 15,979 (68) (32)
Noninterest expense 48,842 50,398 49,393 50,456 49,020 22,598 (3) 17
Net income before
noncontrolling interests 22,224 19,368 16,211 12,663 12,667 2,698 15 52
Less: Net income from
noncontrolling interests 346 471 342 301 392 43 (27) 52
Wells Fargo net income 21,878 18,897 15,869 12,362 12,275 2,655 16 52
Earnings per common share 3.95 3.40 2.85 2.23 1.76 0.70 16 41
Diluted earnings per common share 3.89 3.36 2.82 2.21 1.75 0.70 16 41
Dividends declared per common share 1.15 0.88 0.48 0.20 0.49 1.30 31 (2)
Balance sheet (at year end)
Investment securities $ 264,353 235,199 222,613 172,654 172,710 151,569 12 % 12
Loans 825,799 799,574 769,631 757,267 782,770 864,830 3 (1)
Allowance for loan losses 14,502 17,060 19,372 23,022 24,516 21,013 (15) (7)
Goodwill 25,637 25,637 25,115 24,770 24,812 22,627 - 3
Assets 1,527,015 1,422,968 1,313,867 1,258,128 1,243,646 1,309,639 7 3
Core deposits (2) 980,063 945,749 872,629 798,192 780,737 745,432 4 6
Long-term debt 152,998 127,379 125,354 156,983 203,861 267,158 20 (11)
Wells Fargo stockholders' equity 170,142 157,554 140,241 126,408 111,786 99,084 8 11
Noncontrolling interests 866 1,357 1,446 1,481 2,573 3,232 (36) (23)
Total equity 171,008 158,911 141,687 127,889 114,359 102,316 8 11
(1) The Company acquired Wachovia Corporation (Wachovia) on December 31, 2008. Because the acquisition was completed on December 31, 2008, Wachovia's results are
included in the income statement, average balances and related metrics beginning in 2009. Wachovia's assets and liabilities are included in the consolidated balance sheet
beginning on December 31, 2008.
(2) Core deposits are noninterest-bearing deposits, interest-bearing checking, savings certificates, certain market rate and other savings, and certain foreign deposits
(Eurodollar sweep balances).
32