Wells Fargo 2013 Annual Report Download - page 45
Download and view the complete annual report
Please find page 45 of the 2013 Wells Fargo annual report below. You can navigate through the pages in the report by either clicking on the pages listed below, or by using the keyword search tool below to find specific information within the annual report.-
 1
1 -
2
-
3
-
4
-
5
-
6
-
7
-
8
-
9
-
10
-
11
-
12
-
13
-
14
-
15
-
16
-
17
-
18
-
19
-
20
-
21
-
22
-
23
-
24
-
25
-
26
-
27
-
28
-
29
-
30
-
31
-
32
-
33
-
34
-
 35
35 -
 36
36 -
 37
37 -
 38
38 -
 39
39 -
 40
40 -
 41
41 -
 42
42 -
 43
43 -
 44
44 -
 45
45 -
 46
46 -
 47
47 -
 48
48 -
 49
49 -
 50
50 -
 51
51 -
 52
52 -
 53
53 -
 54
54 -
 55
55 -
56
-
57
-
58
-
59
-
60
-
61
-
62
-
63
-
64
-
65
-
66
-
67
-
68
-
69
-
70
-
71
-
72
-
73
-
74
-
75
-
76
-
77
-
78
-
79
-
80
-
81
-
82
-
83
-
84
-
85
-
86
-
87
-
88
-
89
-
90
-
91
-
92
-
93
-
94
-
95
-
96
-
97
-
98
-
99
-
100
-
101
-
102
-
103
-
104
-
105
-
106
-
107
-
108
-
109
-
110
-
111
-
112
-
113
-
114
-
115
-
116
-
117
-
118
-
119
-
120
-
121
-
122
-
123
-
124
-
125
-
126
-
127
-
128
-
129
-
130
-
131
-
132
-
133
-
134
-
135
-
136
-
137
-
138
-
139
-
140
-
141
-
142
-
143
-
144
-
145
-
146
-
147
-
148
-
149
-
150
-
151
-
152
-
153
-
154
-
155
-
156
-
157
-
158
-
159
-
160
-
161
-
162
-
163
-
164
-
165
-
166
-
167
-
168
-
169
-
170
-
171
-
172
-
173
-
174
-
175
-
176
-
177
-
178
-
179
-
180
-
181
-
182
-
183
-
184
-
185
-
186
-
187
-
188
-
189
-
190
-
191
-
192
-
193
-
194
-
195
-
196
-
197
-
198
-
199
-
200
-
201
-
202
-
203
-
204
-
205
-
206
-
207
-
208
-
209
-
210
-
211
-
212
-
213
-
214
-
215
-
216
-
217
-
218
-
219
-
220
-
221
-
222
-
223
-
224
-
225
-
226
-
227
-
228
-
229
-
230
-
231
-
232
-
233
-
234
-
235
-
236
-
237
-
238
-
239
-
240
-
241
-
242
-
243
-
244
-
245
-
246
-
247
-
248
-
249
-
250
-
251
-
252
-
253
-
254
-
255
-
256
-
257
-
258
-
259
-
260
-
261
-
262
-
263
-
264
-
265
-
266
-
267
-
268
-
269
-
270
-
271
-
272
 |
 |

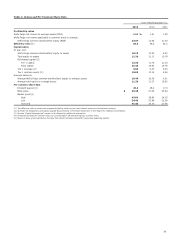
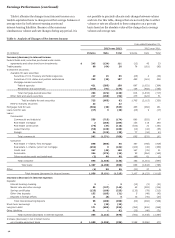
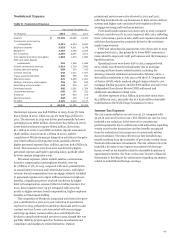
Noninterest Expense
Table 8: Noninterest Expense
Year ended December 31,
(in millions) 2013 2012 2011
Salaries $ 15,152 14,689 14,462
Commission and incentive
compensation 9,951 9,504 8,857
Employee benefits 5,033 4,611 4,348
Equipment 1,984 2,068 2,283
Net occupancy 2,895 2,857 3,011
Core deposit and other intangibles 1,504 1,674 1,880
FDIC and other deposit
assessments 961 1,356 1,266
Outside professional services 2,519 2,729 2,692
Outside data processing 983 910 935
Contract services 935 1,011 1,407
Travel and entertainment 885 839 821
Operating losses 821 2,235 1,261
Postage, stationery and supplies 756 799 942
Advertising and promotion 610 578 607
Foreclosed assets 605 1,061 1,354
Telecommunications 482 500 523
Insurance 437 453 515
Operating leases 204 109 112
All other 2,125 2,415 2,117
Total $ 48,842 50,398 49,393
Noninterest expense was $48.8 billion in 2013, down 3% from
$50.4 billion in 2012, which was up 2% from $49.4 billion in
2011. The decrease in 2013 was driven predominantly by lower
operating losses ($821 million, down from $2.2 billion in 2012),
lower foreclosed assets expense ($605 million, down from
$1.1 billion in 2012), lower FDIC and other deposit assessments
($961 million, down from $1.4 billion in 2012), and the
completion of Wachovia merger integration activities in the prior
year ($218 million in first quarter 2012), partially offset by
higher personnel expense ($30.1 billion, up from $28.8 billion in
2012). The increase in 2012 from 2011 was driven by higher
personnel expense and higher operating losses, partially offset
by lower merger integration costs.
Personnel expenses, which include salaries, commissions,
incentive compensation and employee benefits, were up
$1.3 billion, or 5%, in 2013 compared with 2012, primarily due
to annual salary increases and related salary taxes, and higher
revenue-based compensation (non-mortgage-related). Included
in personnel expense was a $422 million increase in employee
benefits, a significant portion of which was driven by higher
deferred compensation expense (offset in trading income). For
2012, these expenses were up 4% compared with 2011 due
mostly to higher revenue-based compensation, higher employee
benefits, and increased staffing.
The completion of Wachovia integration activities in the prior
year contributed to a year-over-year reduction in noninterest
expense for 2013, primarily in outside professional services and
contract services. Lower costs associated with our mortgage
servicing regulatory consent orders also contributed to the
decline in outside professional services in 2013, though this was
partially offset by project spend on business investments and
compliance and regulatory related initiatives. Outside
professional services were also elevated in 2012 and 2011,
reflecting investments by our businesses in their service delivery
systems and higher costs associated with regulatory driven
mortgage servicing and foreclosure matters.
Foreclosed assets expense was down 43% in 2013 compared
with 2012 and down 22% in 2012 compared with 2011, reflecting
lower write-downs, gains on sale, and lower expenses associated
with foreclosed properties, primarily driven by the real estate
market improvement.
FDIC and other deposit assessments were down 29% in 2013
compared with 2012, due primarily to lower FDIC assessment
rates related to improved credit performance and the Company’s
liquidity position.
Operating losses were down 63% in 2013 compared with
2012, which was elevated predominantly due to mortgage
servicing and foreclosure-related matters, including the
Attorneys General settlement announced in February 2012, a
$175 million settlement in July 2012 with the U.S. Department
of Justice (DOJ), which resolved alleged claims related to our
mortgage lending practices, and the $766 million accrual for the
Independent Foreclosure Review (IFR) settlement and
additional remediation-related costs.
All other expenses of $2.1 billion in 2013 were down from
$2.4 billion in 2012, primarily due to a $250 million charitable
contribution to the Wells Fargo Foundation in 2012.
Income Tax Expense
The 2013 annual effective tax rate was 32.2% compared with
32.5% in 2012 and 31.9% in 2011. The effective tax rate for 2013
included a net reduction in the reserve for uncertain tax
positions primarily due to settlements with authorities regarding
certain cross border transactions and tax benefits recognized
from the realization for tax purposes of a previously written
down investment. The 2012 effective tax rate included a tax
benefit resulting from the surrender of previously written-down
Wachovia life insurance investments. The 2011 effective tax rate
included a decrease in tax expense associated with leverage
leases, as well as tax benefits related to charitable donations of
appreciated securities. See Note 21 (Income Taxes) to Financial
Statements in this Report for information regarding tax matters
related to undistributed foreign earnings.
43