Wells Fargo 2013 Annual Report Download - page 266
Download and view the complete annual report
Please find page 266 of the 2013 Wells Fargo annual report below. You can navigate through the pages in the report by either clicking on the pages listed below, or by using the keyword search tool below to find specific information within the annual report.-
 1
1 -
2
-
3
-
4
-
5
-
6
-
7
-
8
-
9
-
10
-
11
-
12
-
13
-
14
-
15
-
16
-
17
-
18
-
19
-
20
-
21
-
22
-
23
-
24
-
25
-
26
-
27
-
28
-
29
-
30
-
31
-
32
-
33
-
34
-
35
-
36
-
37
-
38
-
39
-
40
-
41
-
42
-
43
-
44
-
45
-
46
-
47
-
48
-
49
-
50
-
51
-
52
-
53
-
54
-
55
-
56
-
57
-
58
-
59
-
60
-
61
-
62
-
63
-
64
-
65
-
66
-
67
-
68
-
69
-
70
-
71
-
72
-
73
-
74
-
75
-
76
-
77
-
78
-
79
-
80
-
81
-
82
-
83
-
84
-
85
-
86
-
87
-
88
-
89
-
90
-
91
-
92
-
93
-
94
-
95
-
96
-
97
-
98
-
99
-
100
-
101
-
102
-
103
-
104
-
105
-
106
-
107
-
108
-
109
-
110
-
111
-
112
-
113
-
114
-
115
-
116
-
117
-
118
-
119
-
120
-
121
-
122
-
123
-
124
-
125
-
126
-
127
-
128
-
129
-
130
-
131
-
132
-
133
-
134
-
135
-
136
-
137
-
138
-
139
-
140
-
141
-
142
-
143
-
144
-
145
-
146
-
147
-
148
-
149
-
150
-
151
-
152
-
153
-
154
-
155
-
156
-
157
-
158
-
159
-
160
-
161
-
162
-
163
-
164
-
165
-
166
-
167
-
168
-
169
-
170
-
171
-
172
-
173
-
174
-
175
-
176
-
177
-
178
-
179
-
180
-
181
-
182
-
183
-
184
-
185
-
186
-
187
-
188
-
189
-
190
-
191
-
192
-
193
-
194
-
195
-
196
-
197
-
198
-
199
-
200
-
201
-
202
-
203
-
204
-
205
-
206
-
207
-
208
-
209
-
210
-
211
-
212
-
213
-
214
-
215
-
216
-
217
-
218
-
219
-
220
-
221
-
222
-
223
-
224
-
225
-
226
-
227
-
228
-
229
-
230
-
231
-
232
-
233
-
234
-
235
-
236
-
237
-
238
-
239
-
240
-
241
-
242
-
243
-
244
-
245
-
246
-
247
-
248
-
249
-
250
-
251
-
252
-
253
-
254
-
255
-
 256
256 -
 257
257 -
 258
258 -
 259
259 -
 260
260 -
 261
261 -
 262
262 -
 263
263 -
 264
264 -
 265
265 -
 266
266 -
 267
267 -
 268
268 -
 269
269 -
 270
270 -
 271
271 -
 272
272
 |
 |

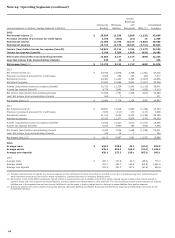
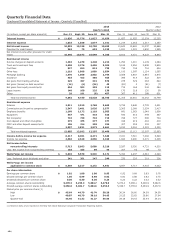
Quarterly Financial Data
Condensed Consolidated Statement of Income - Quarterly (Unaudited)
2013
Quarter ended
2012
Quarter ended
(in millions, except per share amounts) Dec. 31 Sept. 30 June 30 Mar. 31 Dec. 31 Sept. 30 June 30 Mar. 31
Interest income $ 11,836 11,776 11,827 11,650 11,857 11,925 12,354 12,255
Interest expense 1,033 1,028 1,077 1,151 1,214 1,263 1,317 1,367
Net interest income 10,803 10,748 10,750 10,499 10,643 10,662 11,037 10,888
Provision for credit losses 363 75 652 1,219 1,831 1,591 1,800 1,995
Net interest income after provision for credit
losses 10,440 10,673 10,098 9,280 8,812 9,071 9,237 8,893
Noninterest income
Service charges on deposit accounts 1,283 1,278 1,248 1,214 1,250 1,210 1,139 1,084
Trust and investment fees 3,458 3,276 3,494 3,202 3,199 2,954 2,898 2,839
Card fees 827 813 813 738 736 744 704 654
Other fees 1,119 1,098 1,089 1,034 1,193 1,097 1,134 1,095
Mortgage banking 1,570 1,608 2,802 2,794 3,068 2,807 2,893 2,870
Insurance 453 413 485 463 395 414 522 519
Net gains from trading activities 325 397 331 570 275 529 263 640
Net gains (losses) on debt securities (14) (6) (54) 45 (63) 3 (61) (7)
Net gains from equity investments 654 502 203 113 715 164 242 364
Lease income 148 160 225 130 170 218 120 59
Other 39 191 (8) 457 367 411 398 631
Total noninterest income 9,862 9,730 10,628 10,760 11,305 10,551 10,252 10,748
Noninterest expense
Salaries 3,811 3,910 3,768 3,663 3,735 3,648 3,705 3,601
Commission and incentive compensation 2,347 2,401 2,626 2,577 2,365 2,368 2,354 2,417
Employee benefits 1,160 1,172 1,118 1,583 891 1,063 1,049 1,608
Equipment 567 471 418 528 542 510 459 557
Net occupancy 732 728 716 719 728 727 698 704
Core deposit and other intangibles 375 375 377 377 418 419 418 419
FDIC and other deposit assessments 196 214 259 292 307 359 333 357
Other 2,897 2,831 2,973 2,661 3,910 3,018 3,381 3,330
Total noninterest expense 12,085 12,102 12,255 12,400 12,896 12,112 12,397 12,993
Income before income tax expense 8,217 8,301 8,471 7,640 7,221 7,510 7,092 6,648
Income tax expense 2,504 2,618 2,863 2,420 1,924 2,480 2,371 2,328
Net income before
noncontrolling interests 5,713 5,683 5,608 5,220 5,297 5,030 4,721 4,320
Less: Net income from noncontrolling interests 103 105 89 49 207 93 99 72
Wells Fargo net income $ 5,610 5,578 5,519 5,171 5,090 4,937 4,622 4,248
Less: Preferred stock dividends and other 241 261 247 240 233 220 219 226
Wells Fargo net income
applicable to common stock $ 5,369 5,317 5,272 4,931 4,857 4,717 4,403 4,022
Per share information
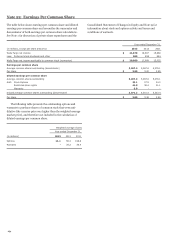
Earnings per common share $ 1.02 1.00 1.00 0.93 0.92 0.89 0.83 0.76
Diluted earnings per common share 1.00 0.99 0.98 0.92 0.91 0.88 0.82 0.75
Dividends declared per common share 0.30 0.30 0.30 0.25 0.22 0.22 0.22 0.22
Average common shares outstanding 5,270.3 5,295.3 5,304.7 5,279.0 5,272.4 5,288.1 5,306.9 5,282.6
Diluted average common shares outstanding 5,358.6 5,381.7 5,384.6 5,353.5 5,338.7 5,355.6 5,369.9 5,337.8
Market price per common share (1)
High $ 45.64 44.79 41.74 38.20 36.34 36.60 34.59 34.59
Low 40.07 40.79 36.19 34.43 31.25 32.62 29.80 27.94
Quarter-end 45.40 41.32 41.27 36.99 34.18 34.53 33.44 34.14
(1) Based on daily prices reported on the New York Stock Exchange Composite Transaction Reporting System.
264