Wells Fargo 2013 Annual Report Download - page 173
Download and view the complete annual report
Please find page 173 of the 2013 Wells Fargo annual report below. You can navigate through the pages in the report by either clicking on the pages listed below, or by using the keyword search tool below to find specific information within the annual report.-
 1
1 -
2
-
3
-
4
-
5
-
6
-
7
-
8
-
9
-
10
-
11
-
12
-
13
-
14
-
15
-
16
-
17
-
18
-
19
-
20
-
21
-
22
-
23
-
24
-
25
-
26
-
27
-
28
-
29
-
30
-
31
-
32
-
33
-
34
-
35
-
36
-
37
-
38
-
39
-
40
-
41
-
42
-
43
-
44
-
45
-
46
-
47
-
48
-
49
-
50
-
51
-
52
-
53
-
54
-
55
-
56
-
57
-
58
-
59
-
60
-
61
-
62
-
63
-
64
-
65
-
66
-
67
-
68
-
69
-
70
-
71
-
72
-
73
-
74
-
75
-
76
-
77
-
78
-
79
-
80
-
81
-
82
-
83
-
84
-
85
-
86
-
87
-
88
-
89
-
90
-
91
-
92
-
93
-
94
-
95
-
96
-
97
-
98
-
99
-
100
-
101
-
102
-
103
-
104
-
105
-
106
-
107
-
108
-
109
-
110
-
111
-
112
-
113
-
114
-
115
-
116
-
117
-
118
-
119
-
120
-
121
-
122
-
123
-
124
-
125
-
126
-
127
-
128
-
129
-
130
-
131
-
132
-
133
-
134
-
135
-
136
-
137
-
138
-
139
-
140
-
141
-
142
-
143
-
144
-
145
-
146
-
147
-
148
-
149
-
150
-
151
-
152
-
153
-
154
-
155
-
156
-
157
-
158
-
159
-
160
-
161
-
162
-
 163
163 -
 164
164 -
 165
165 -
 166
166 -
 167
167 -
 168
168 -
 169
169 -
 170
170 -
 171
171 -
 172
172 -
 173
173 -
 174
174 -
 175
175 -
 176
176 -
 177
177 -
 178
178 -
 179
179 -
 180
180 -
 181
181 -
 182
182 -
 183
183 -
184
-
185
-
186
-
187
-
188
-
189
-
190
-
191
-
192
-
193
-
194
-
195
-
196
-
197
-
198
-
199
-
200
-
201
-
202
-
203
-
204
-
205
-
206
-
207
-
208
-
209
-
210
-
211
-
212
-
213
-
214
-
215
-
216
-
217
-
218
-
219
-
220
-
221
-
222
-
223
-
224
-
225
-
226
-
227
-
228
-
229
-
230
-
231
-
232
-
233
-
234
-
235
-
236
-
237
-
238
-
239
-
240
-
241
-
242
-
243
-
244
-
245
-
246
-
247
-
248
-
249
-
250
-
251
-
252
-
253
-
254
-
255
-
256
-
257
-
258
-
259
-
260
-
261
-
262
-
263
-
264
-
265
-
266
-
267
-
268
-
269
-
270
-
271
-
272
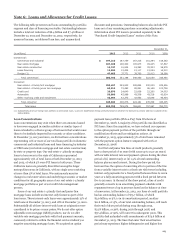
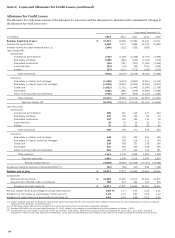
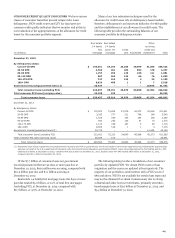
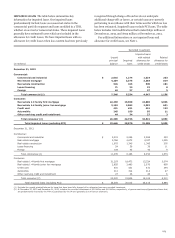
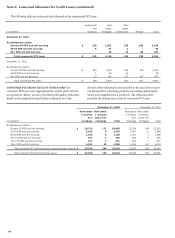
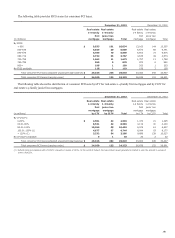
 |
 |

December 31, 2013 December 31, 2012
(in millions)
Real estate
1-4 family
first
mortgage
by LTV
Real estate
1-4 family
junior lien
mortgage
by CLTV Total
Real estate
1-4 family
first
mortgage
by LTV
Real estate
1-4 family
junior lien
mortgage
by CLTV Total
By LTV/CLTV:
0-60% $ 74,046 13,636 87,682 56,247 12,170 68,417
60.01-80% 80,187 17,154 97,341 69,759 15,168 84,927
80.01-100% 30,843 16,272 47,115 34,830 18,038 52,868
100.01-120% (1) 10,678 9,992 20,670 17,004 13,576 30,580
> 120% (1) 6,306 7,369 13,675 13,529 14,610 28,139
No LTV/CLTV available 1,600 1,368 2,968 1,973 1,751 3,724
Government insured/guaranteed loans (2) 30,737 - 30,737 29,719 -29,719
Total consumer loans (excluding PCI) 234,397 65,791 300,188 223,061 75,313 298,374
Total consumer PCI loans (carrying value) 24,100 123 24,223 26,839 152 26,991
Total consumer loans $ 258,497 65,914 324,411 249,900 75,465 325,365
(1) Reflects total loan balances with LTV/CLTV amounts in excess of 100%. In the event of default, the loss content would generally be limited to only the amount in excess of
100% LTV/CLTV.
(2) Represents loans whose repayments are predominantly insured by the FHA or guaranteed by the VA.
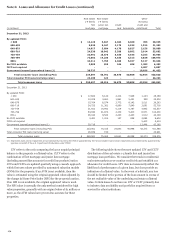
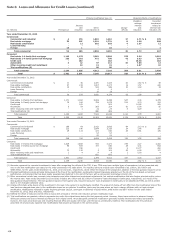
NONACCRUAL LOANS The following table provides loans on
nonaccrual status. PCI loans are excluded from this table
because they continue to earn interest from accretable yield,
independent of performance in accordance with their
contractual terms.
(in millions)
Dec. 31,
2013
Dec. 31,
2012
Commercial:
Commercial and industrial $ 738 1,422
Real estate mortgage 2,252 3,322
Real estate construction 416 1,003
Lease financing 29 27
Foreign 40 50
Total commercial (1) 3,475 5,824
Consumer:
Real estate 1-4 family first mortgage (2 9,799 )11,455
Real estate 1-4 family junior lien mortg 2,188 age 2,922
Automobile 173 245
Other revolving credit and installment 33 40
Total consumer 12,193 14,662
Total nonaccrual loans
(excluding PCI) $ 15,668 20,486
(1) Includes LHFS of $1 million and $16 million at December 31, 2013 and
December 31, 2012, respectively.
(2) Includes MHFS of $227 million and $336 million at December 31, 2013 and
December 31, 2012, respectively.
171