Wells Fargo 2013 Annual Report Download - page 169
Download and view the complete annual report
Please find page 169 of the 2013 Wells Fargo annual report below. You can navigate through the pages in the report by either clicking on the pages listed below, or by using the keyword search tool below to find specific information within the annual report.-
 1
1 -
2
-
3
-
4
-
5
-
6
-
7
-
8
-
9
-
10
-
11
-
12
-
13
-
14
-
15
-
16
-
17
-
18
-
19
-
20
-
21
-
22
-
23
-
24
-
25
-
26
-
27
-
28
-
29
-
30
-
31
-
32
-
33
-
34
-
35
-
36
-
37
-
38
-
39
-
40
-
41
-
42
-
43
-
44
-
45
-
46
-
47
-
48
-
49
-
50
-
51
-
52
-
53
-
54
-
55
-
56
-
57
-
58
-
59
-
60
-
61
-
62
-
63
-
64
-
65
-
66
-
67
-
68
-
69
-
70
-
71
-
72
-
73
-
74
-
75
-
76
-
77
-
78
-
79
-
80
-
81
-
82
-
83
-
84
-
85
-
86
-
87
-
88
-
89
-
90
-
91
-
92
-
93
-
94
-
95
-
96
-
97
-
98
-
99
-
100
-
101
-
102
-
103
-
104
-
105
-
106
-
107
-
108
-
109
-
110
-
111
-
112
-
113
-
114
-
115
-
116
-
117
-
118
-
119
-
120
-
121
-
122
-
123
-
124
-
125
-
126
-
127
-
128
-
129
-
130
-
131
-
132
-
133
-
134
-
135
-
136
-
137
-
138
-
139
-
140
-
141
-
142
-
143
-
144
-
145
-
146
-
147
-
148
-
149
-
150
-
151
-
152
-
153
-
154
-
155
-
156
-
157
-
158
-
 159
159 -
 160
160 -
 161
161 -
 162
162 -
 163
163 -
 164
164 -
 165
165 -
 166
166 -
 167
167 -
 168
168 -
 169
169 -
 170
170 -
 171
171 -
 172
172 -
 173
173 -
 174
174 -
 175
175 -
 176
176 -
 177
177 -
 178
178 -
 179
179 -
180
-
181
-
182
-
183
-
184
-
185
-
186
-
187
-
188
-
189
-
190
-
191
-
192
-
193
-
194
-
195
-
196
-
197
-
198
-
199
-
200
-
201
-
202
-
203
-
204
-
205
-
206
-
207
-
208
-
209
-
210
-
211
-
212
-
213
-
214
-
215
-
216
-
217
-
218
-
219
-
220
-
221
-
222
-
223
-
224
-
225
-
226
-
227
-
228
-
229
-
230
-
231
-
232
-
233
-
234
-
235
-
236
-
237
-
238
-
239
-
240
-
241
-
242
-
243
-
244
-
245
-
246
-
247
-
248
-
249
-
250
-
251
-
252
-
253
-
254
-
255
-
256
-
257
-
258
-
259
-
260
-
261
-
262
-
263
-
264
-
265
-
266
-
267
-
268
-
269
-
270
-
271
-
272
 |
 |

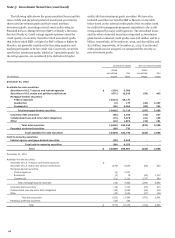
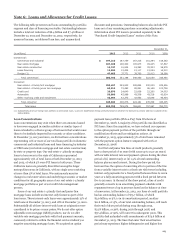
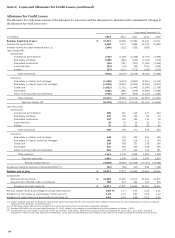
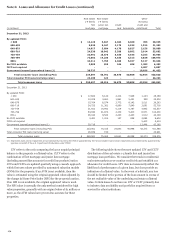
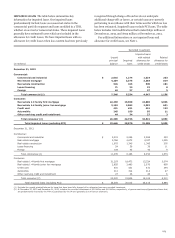
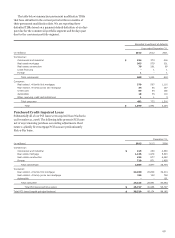
The following table summarizes the activity in the allowance for credit losses by our commercial and consumer portfolio segments.
Year ended December 31,
2013 2012
(in millions) Commercial Consumer Total Commercial Consumer Total
Balance, beginning of period $ 5,714 11,763 17,477 6,358 13,310 19,668
Provision for credit losses 671 1,638 2,309 666 6,551 7,217
Interest income on certain impaired loans (54) (210) (264) (95) (220) (315)
Loan charge-offs (993) (5,417) (6,410) (2,014) (8,959) (10,973)
Loan recoveries 787 1,114 1,901 799 1,140 1,939
Net loan charge-offs (206) (4,303) (4,509) (1,215) (7,819) (9,034)
Allowance related to business combinations/other (22) (20) (42) - (59) (59)
Balance, end of period $ 6,103 8,868 14,971 5,714 11,763 17,477
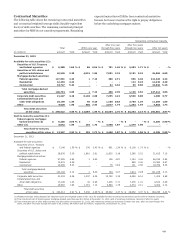
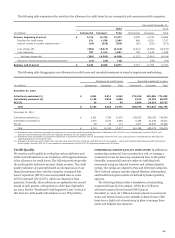
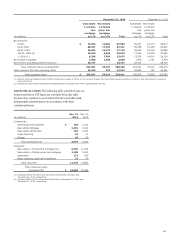
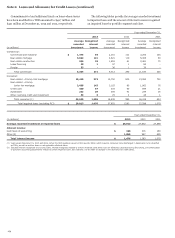
The following table disaggregates our allowance for credit losses and recorded investment in loans by impairment methodology.
Allowance for credit losses Recorded investment in loans
(in millions) Commercial onsumer C Total Commercial Consumer Total
December 31, 2013
Collectively evaluated (1) $ 4,921 5,011 9,932 372,918 398,084 771,002
Individually evaluated (2) 1,156 3,853 5,009 5,334 22,736 28,070
PCI (3) 26 4 30 2,504 24,223 26,727
Total $ 6,103 8,868 14,971 380,756 445,043 825,799
December 31, 2012
Collectively evaluated (1) $ 3,951 7,524 11,475 349,035 389,559 738,594
Individually evaluated (2) 1,675 4,210 5,885 8,186 21,826 30,012
PCI (3) 88 29 117 3,977 26,991 30,968
Total $ 5,714 11,763 17,477 361,198 438,376 799,574
(1) Represents loans collectively evaluated for impairment in accordance with Accounting Standards Codification (ASC) 450-20, Loss Contingencies (formerly FAS 5), and
pursuant to amendments by ASU 2010-20 regarding allowance for non-impaired loans.
(2) Represents loans individually evaluated for impairment in accordance with ASC 310-10, Receivables (formerly FAS 114), and pursuant to amendments by ASU 2010-20
regarding allowance for impaired loans.
(3) Represents the allowance and related loan carrying value determined in accordance with ASC 310-30, Receivables – Loans and Debt Securities Acquired with Deteriorated
Credit Quality (formerly SOP 03-3) and pursuant to amendments by ASU 2010-20 regarding allowance for PCI loans.
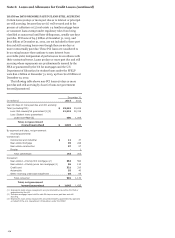
Credit Quality
We monitor credit quality by evaluating various attributes and
utilize such information in our evaluation of the appropriateness
of the allowance for credit losses. The following sections provide
the credit quality indicators we most closely monitor. The credit
quality indicators are generally based on information as of our
financial statement date, with the exception of updated Fair
Isaac Corporation (FICO) scores and updated loan-to-value
(LTV)/combined LTV (CLTV), which are obtained at least
quarterly. Generally, these indicators are updated in the second
month of each quarter, with updates no older than September
30, 2013. See the “Purchased Credit-Impaired Loans” section of
this Note for credit quality information on our PCI portfolio.
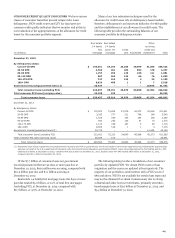
COMMERCIAL CREDIT QUALITY INDICATORS In addition to
monitoring commercial loan concentration risk, we manage a
consistent process for assessing commercial loan credit quality.
Generally, commercial loans are subject to individual risk
assessment using our internal borrower and collateral quality
ratings. Our ratings are aligned to Pass and Criticized categories.
The Criticized category includes Special Mention, Substandard,
and Doubtful categories which are defined by bank regulatory
agencies.
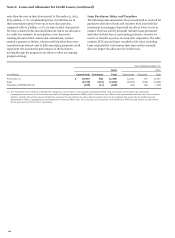
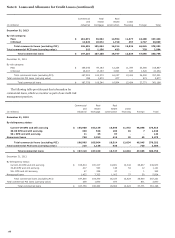
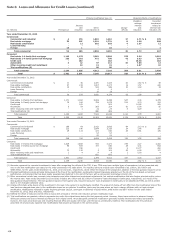
The following table provides a breakdown of outstanding
commercial loans by risk category. Of the $12.7 billion in
criticized commercial real estate (CRE) loans at
December 31, 2013, $2.7 billion has been placed on nonaccrual
status and written down to net realizable collateral value. CRE
loans have a high level of monitoring in place to manage these
assets and mitigate loss exposure.
167