Wells Fargo 2013 Annual Report Download - page 220
Download and view the complete annual report
Please find page 220 of the 2013 Wells Fargo annual report below. You can navigate through the pages in the report by either clicking on the pages listed below, or by using the keyword search tool below to find specific information within the annual report.-
 1
1 -
2
-
3
-
4
-
5
-
6
-
7
-
8
-
9
-
10
-
11
-
12
-
13
-
14
-
15
-
16
-
17
-
18
-
19
-
20
-
21
-
22
-
23
-
24
-
25
-
26
-
27
-
28
-
29
-
30
-
31
-
32
-
33
-
34
-
35
-
36
-
37
-
38
-
39
-
40
-
41
-
42
-
43
-
44
-
45
-
46
-
47
-
48
-
49
-
50
-
51
-
52
-
53
-
54
-
55
-
56
-
57
-
58
-
59
-
60
-
61
-
62
-
63
-
64
-
65
-
66
-
67
-
68
-
69
-
70
-
71
-
72
-
73
-
74
-
75
-
76
-
77
-
78
-
79
-
80
-
81
-
82
-
83
-
84
-
85
-
86
-
87
-
88
-
89
-
90
-
91
-
92
-
93
-
94
-
95
-
96
-
97
-
98
-
99
-
100
-
101
-
102
-
103
-
104
-
105
-
106
-
107
-
108
-
109
-
110
-
111
-
112
-
113
-
114
-
115
-
116
-
117
-
118
-
119
-
120
-
121
-
122
-
123
-
124
-
125
-
126
-
127
-
128
-
129
-
130
-
131
-
132
-
133
-
134
-
135
-
136
-
137
-
138
-
139
-
140
-
141
-
142
-
143
-
144
-
145
-
146
-
147
-
148
-
149
-
150
-
151
-
152
-
153
-
154
-
155
-
156
-
157
-
158
-
159
-
160
-
161
-
162
-
163
-
164
-
165
-
166
-
167
-
168
-
169
-
170
-
171
-
172
-
173
-
174
-
175
-
176
-
177
-
178
-
179
-
180
-
181
-
182
-
183
-
184
-
185
-
186
-
187
-
188
-
189
-
190
-
191
-
192
-
193
-
194
-
195
-
196
-
197
-
198
-
199
-
200
-
201
-
202
-
203
-
204
-
205
-
206
-
207
-
208
-
209
-
 210
210 -
 211
211 -
 212
212 -
 213
213 -
 214
214 -
 215
215 -
 216
216 -
 217
217 -
 218
218 -
 219
219 -
 220
220 -
 221
221 -
 222
222 -
 223
223 -
 224
224 -
 225
225 -
 226
226 -
 227
227 -
 228
228 -
 229
229 -
 230
230 -
231
-
232
-
233
-
234
-
235
-
236
-
237
-
238
-
239
-
240
-
241
-
242
-
243
-
244
-
245
-
246
-
247
-
248
-
249
-
250
-
251
-
252
-
253
-
254
-
255
-
256
-
257
-
258
-
259
-
260
-
261
-
262
-
263
-
264
-
265
-
266
-
267
-
268
-
269
-
270
-
271
-
272
 |
 |
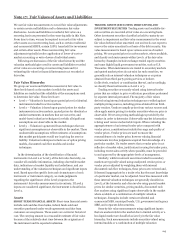
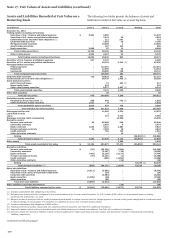
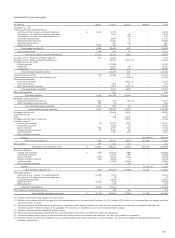
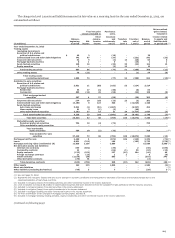
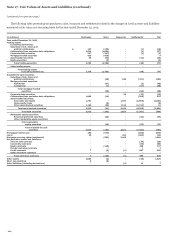
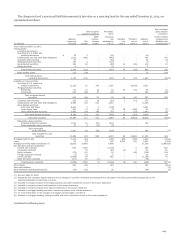
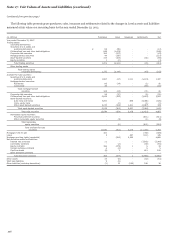
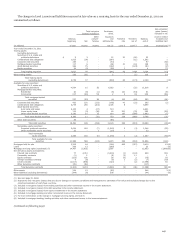
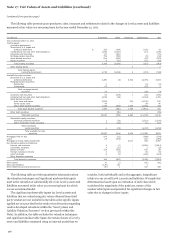
Note 17: Fair Values of Assets and Liabilities (continued)
transactions or other market data within the same or similar
asset classes. This ensures modeled approaches are appropriate
given similar product valuation techniques and are in line with
their intended purpose.
We have ongoing monitoring procedures in place for our
Level 3 assets and liabilities that use such internal valuation
models. These procedures, which are designed to provide
reasonable assurance that models continue to perform as
expected after approved, include:
• ongoing analysis and benchmarking to market transactions
and other independent market data (including pricing
vendors, if available);
•back-testing of modeled fair values to actual realized
transactions; and
•review of modeled valuation results against expectations,
including review of significant or unusual value fluctuations.
We update model inputs and methodologies periodically to
reflect these monitoring procedures. Additionally, procedures
and controls are in place to ensure existing models are subject to
periodic reviews, and we perform full model revalidations as
necessary.
All internal valuation models are subject to ongoing review
by business-unit-level management, and all models are subject
to additional oversight by a corporate-level risk management
department. Corporate oversight responsibilities include
evaluating adequacy of business unit risk management
programs, maintaining company-wide model validation policies
and standards and reporting the results of these activities to
management and our Corporate Model Risk Committee (CMoR).
The CMoR consists of senior executive management and reports
on top model risk issues to the Company’s Risk Committee of the
Board.
VENDOR-DEVELOPED VALUATIONS In certain limited
circumstances we obtain pricing from third party vendors for the
value of our Level 3 assets or liabilities. We have processes in
place to approve such vendors to ensure information obtained
and valuation techniques used are appropriate. Once these
vendors are approved to provide pricing information, we
monitor and review the results to ensure the fair values are
reasonable and in line with market experience in similar asset
classes. While the input amounts used by the pricing vendor in
determining fair value are not provided, and therefore
unavailable for our review, we do perform one or more of the
following procedures to validate the prices received:
• comparison to other pricing vendors (if available);
• variance analysis of prices;
• corroboration of pricing by reference to other independent
market data, such as market transactions and relevant
benchmark indices;
• review of pricing by Company personnel familiar with
market liquidity and other market-related conditions; and
• investigation of prices on a specific instrument-by-
instrument basis.
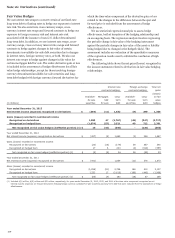
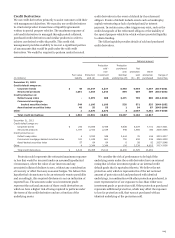
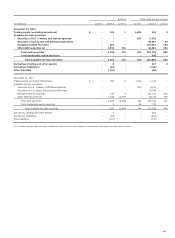
Fair Value Measurements from Brokers or Third
Party Pricing Services
For certain assets and liabilities, we obtain fair value
measurements from brokers or third party pricing services and
record the unadjusted fair value in our financial statements. The
detail by level is shown in the table below. Fair value
measurements obtained from brokers or third party pricing
services that we have adjusted to determine the fair value
recorded in our financial statements are not included in the
following table.
218