Wells Fargo 2013 Annual Report Download - page 200
Download and view the complete annual report
Please find page 200 of the 2013 Wells Fargo annual report below. You can navigate through the pages in the report by either clicking on the pages listed below, or by using the keyword search tool below to find specific information within the annual report.-
 1
1 -
2
-
3
-
4
-
5
-
6
-
7
-
8
-
9
-
10
-
11
-
12
-
13
-
14
-
15
-
16
-
17
-
18
-
19
-
20
-
21
-
22
-
23
-
24
-
25
-
26
-
27
-
28
-
29
-
30
-
31
-
32
-
33
-
34
-
35
-
36
-
37
-
38
-
39
-
40
-
41
-
42
-
43
-
44
-
45
-
46
-
47
-
48
-
49
-
50
-
51
-
52
-
53
-
54
-
55
-
56
-
57
-
58
-
59
-
60
-
61
-
62
-
63
-
64
-
65
-
66
-
67
-
68
-
69
-
70
-
71
-
72
-
73
-
74
-
75
-
76
-
77
-
78
-
79
-
80
-
81
-
82
-
83
-
84
-
85
-
86
-
87
-
88
-
89
-
90
-
91
-
92
-
93
-
94
-
95
-
96
-
97
-
98
-
99
-
100
-
101
-
102
-
103
-
104
-
105
-
106
-
107
-
108
-
109
-
110
-
111
-
112
-
113
-
114
-
115
-
116
-
117
-
118
-
119
-
120
-
121
-
122
-
123
-
124
-
125
-
126
-
127
-
128
-
129
-
130
-
131
-
132
-
133
-
134
-
135
-
136
-
137
-
138
-
139
-
140
-
141
-
142
-
143
-
144
-
145
-
146
-
147
-
148
-
149
-
150
-
151
-
152
-
153
-
154
-
155
-
156
-
157
-
158
-
159
-
160
-
161
-
162
-
163
-
164
-
165
-
166
-
167
-
168
-
169
-
170
-
171
-
172
-
173
-
174
-
175
-
176
-
177
-
178
-
179
-
180
-
181
-
182
-
183
-
184
-
185
-
186
-
187
-
188
-
189
-
 190
190 -
 191
191 -
 192
192 -
 193
193 -
 194
194 -
 195
195 -
 196
196 -
 197
197 -
 198
198 -
 199
199 -
 200
200 -
 201
201 -
 202
202 -
 203
203 -
 204
204 -
 205
205 -
 206
206 -
 207
207 -
 208
208 -
 209
209 -
 210
210 -
211
-
212
-
213
-
214
-
215
-
216
-
217
-
218
-
219
-
220
-
221
-
222
-
223
-
224
-
225
-
226
-
227
-
228
-
229
-
230
-
231
-
232
-
233
-
234
-
235
-
236
-
237
-
238
-
239
-
240
-
241
-
242
-
243
-
244
-
245
-
246
-
247
-
248
-
249
-
250
-
251
-
252
-
253
-
254
-
255
-
256
-
257
-
258
-
259
-
260
-
261
-
262
-
263
-
264
-
265
-
266
-
267
-
268
-
269
-
270
-
271
-
272
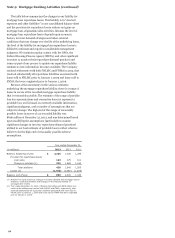
 |
 |
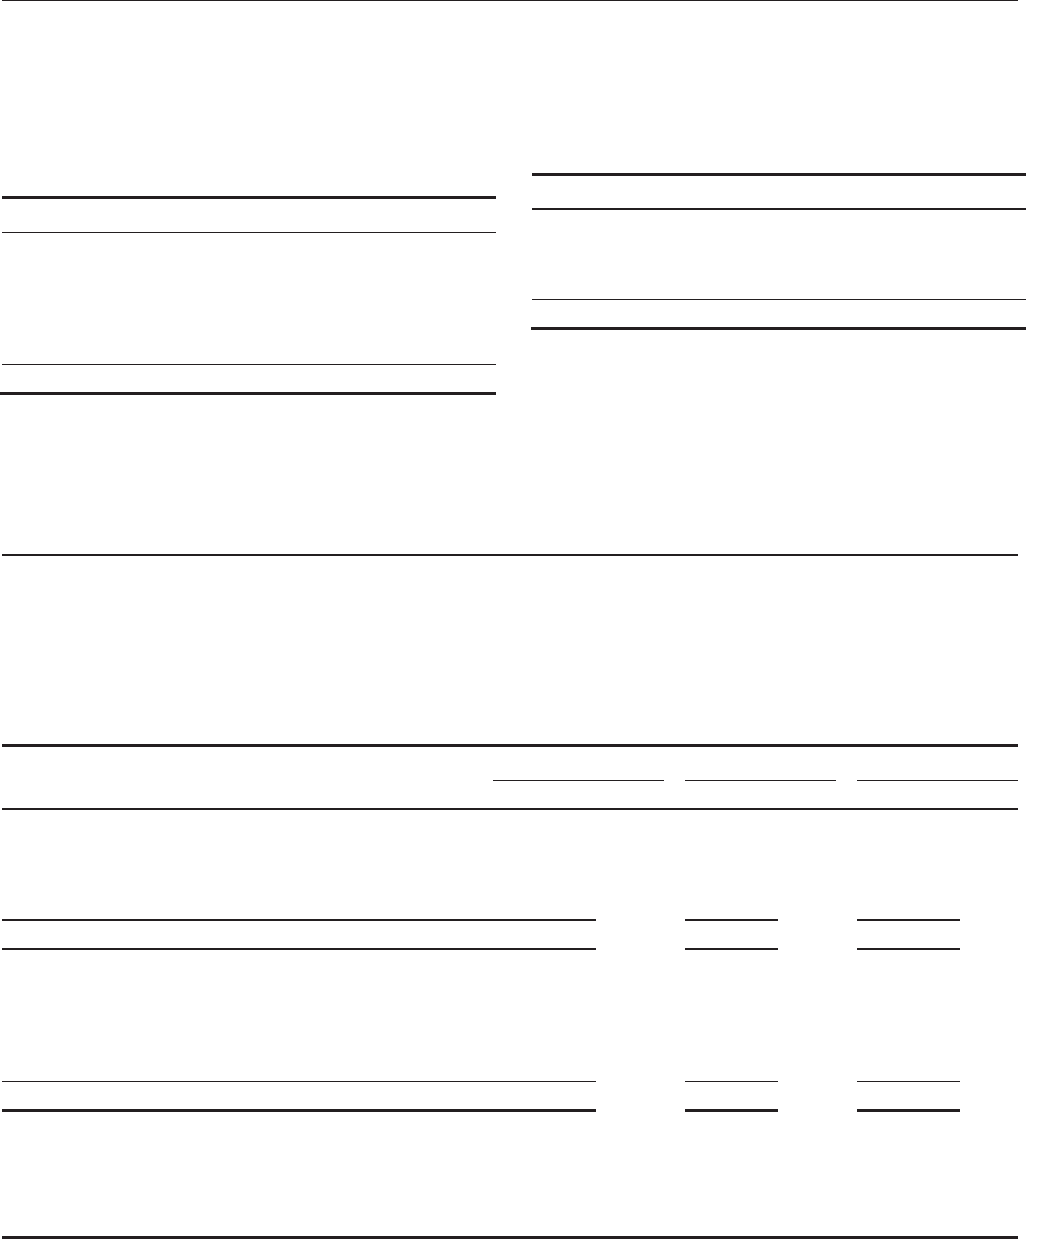
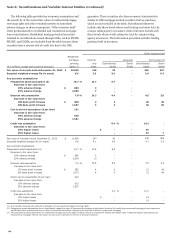
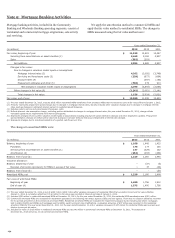
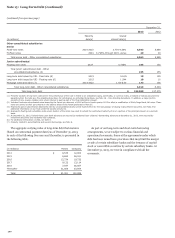
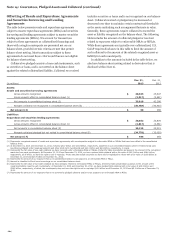
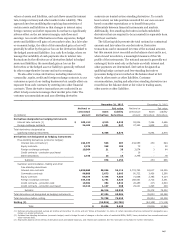
Note 11: Deposits
Time certificates of deposit (CDs) and other time deposits issued
by domestic and foreign offices totaled $117.4 billion and
$90.1 billion at December 31, 2013 and 2012, respectively.
Substantially all of these deposits were interest bearing. The
contractual maturities of these deposits are presented in the
following table.
(in millions) December 31, 2013
2014 $ 86,958
2015 13,308
2016 7,624
2017 2,661
2018 3,263
Thereafter 3,619
Total $ 117,433
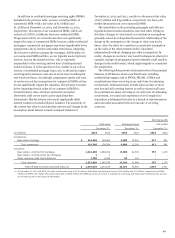
Of these deposits, the amount of domestic time deposits with
a denomination of $100,000 or more was $16.6 billion and
$23.7 billion at December 31, 2013 and 2012, respectively. The
contractual maturities of these deposits are presented in the
following table.
(in millions) 2013
Three months or less $ 3,177
After three months through six months 2,003
After six months through twelve months 2,741
After twelve months 8,685
Total $ 16,606
Time CDs and other time deposits issued by foreign offices
with a denomination of $100,000 or more were $15.3 billion and
$11.7 billion at December 31, 2013 and 2012, respectively.
Demand deposit overdrafts of $554 million and $806 million
were included as loan balances at December 31, 2013 and 2012,
respectively.
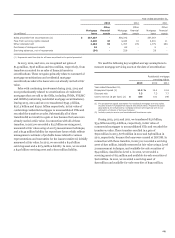
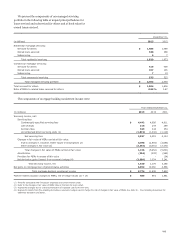
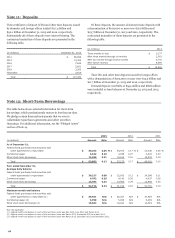
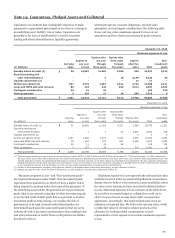
Note 12: Short-Term Borrowings
The table below shows selected information for short-term
borrowings, which predominantly mature in less than 30 days.
We pledge certain financial instruments that we own to
collateralize repurchase agreements and other securities
financings. For additional information, see the “Pledged Assets”
section of Note 14.
2013 2012 2011
(in millions) Amount Rate Amount Rate Amount Rate
As of December 31,
Federal funds purchased and securities sold
under agreements to repurchase $ 36,263 0.05 % $ 34,973 0.17 % $ 31,038 0.05 %
Commercial paper 5,162 0.18 4,038 0.27 3,624 0.23
Other short-term borrowings 12,458 0.31 18,164 0.16 14,429 0.18
Total $ 53,883 0.12 $ 57,175 0.17 $ 49,091 0.10
Year ended December 31,
Average daily balance
Federal funds purchased and securities sold
under agreements to repurchase $ 36,227 0.08 $ 32,092 0.12 $ 34,388 0.11
Commercial paper 4,702 0.25 4,142 0.26 4,437 0.26
Other short-term borrowings 13,787 0.22 14,962 0.29 12,956 0.35
Total $ 54,716 0.13 $ 51,196 0.18 $ 51,781 0.18
Maximum month-end balance
Federal funds purchased and securities sold
under agreements to repurchase (1) $ 39,451 N/A $ 36,327 N/A $ 37,509 N/A
Commercial paper (2) 5,700 N/A 5,036 N/A 6,229 N/A
Other short-term borrowings (3) 16,564 N/A 18,164 N/A 14,429 N/A
N/A- Not applicable
(1) Highest month-end balance in each of the last three years was May 2013, June 2012 and March 2011.
(2) Highest month-end balance in each of the last three years was March 2013, September 2012 and April 2011.
(3) Highest month-end balance in each of the last three years was March 2013, December 2012 and December 2011.
198