Wells Fargo 2013 Annual Report Download - page 83
Download and view the complete annual report
Please find page 83 of the 2013 Wells Fargo annual report below. You can navigate through the pages in the report by either clicking on the pages listed below, or by using the keyword search tool below to find specific information within the annual report.-
 1
1 -
2
-
3
-
4
-
5
-
6
-
7
-
8
-
9
-
10
-
11
-
12
-
13
-
14
-
15
-
16
-
17
-
18
-
19
-
20
-
21
-
22
-
23
-
24
-
25
-
26
-
27
-
28
-
29
-
30
-
31
-
32
-
33
-
34
-
35
-
36
-
37
-
38
-
39
-
40
-
41
-
42
-
43
-
44
-
45
-
46
-
47
-
48
-
49
-
50
-
51
-
52
-
53
-
54
-
55
-
56
-
57
-
58
-
59
-
60
-
61
-
62
-
63
-
64
-
65
-
66
-
67
-
68
-
69
-
70
-
71
-
72
-
 73
73 -
 74
74 -
 75
75 -
 76
76 -
 77
77 -
 78
78 -
 79
79 -
 80
80 -
 81
81 -
 82
82 -
 83
83 -
 84
84 -
 85
85 -
 86
86 -
 87
87 -
 88
88 -
 89
89 -
 90
90 -
 91
91 -
 92
92 -
 93
93 -
94
-
95
-
96
-
97
-
98
-
99
-
100
-
101
-
102
-
103
-
104
-
105
-
106
-
107
-
108
-
109
-
110
-
111
-
112
-
113
-
114
-
115
-
116
-
117
-
118
-
119
-
120
-
121
-
122
-
123
-
124
-
125
-
126
-
127
-
128
-
129
-
130
-
131
-
132
-
133
-
134
-
135
-
136
-
137
-
138
-
139
-
140
-
141
-
142
-
143
-
144
-
145
-
146
-
147
-
148
-
149
-
150
-
151
-
152
-
153
-
154
-
155
-
156
-
157
-
158
-
159
-
160
-
161
-
162
-
163
-
164
-
165
-
166
-
167
-
168
-
169
-
170
-
171
-
172
-
173
-
174
-
175
-
176
-
177
-
178
-
179
-
180
-
181
-
182
-
183
-
184
-
185
-
186
-
187
-
188
-
189
-
190
-
191
-
192
-
193
-
194
-
195
-
196
-
197
-
198
-
199
-
200
-
201
-
202
-
203
-
204
-
205
-
206
-
207
-
208
-
209
-
210
-
211
-
212
-
213
-
214
-
215
-
216
-
217
-
218
-
219
-
220
-
221
-
222
-
223
-
224
-
225
-
226
-
227
-
228
-
229
-
230
-
231
-
232
-
233
-
234
-
235
-
236
-
237
-
238
-
239
-
240
-
241
-
242
-
243
-
244
-
245
-
246
-
247
-
248
-
249
-
250
-
251
-
252
-
253
-
254
-
255
-
256
-
257
-
258
-
259
-
260
-
261
-
262
-
263
-
264
-
265
-
266
-
267
-
268
-
269
-
270
-
271
-
272
 |
 |

Our liability for mortgage repurchases, included in “Accrued
expenses and other liabilities” in our consolidated balance sheet,
was $899 million at December 31, 2013 and $2.2 billion at
December 31, 2012. In 2013, we provided $428 million, which
reduced net gains on mortgage loan origination/sales activities,
compared with a provision of $1.9 billion for 2012 and
$1.3 billion for 2011. Our provision in 2013 reflected an increase
in projected repurchase losses for the GSE pre-2009 vintages to
incorporate the impact of trends in file requests and repurchase
demand activity observed in the first quarter (comprising
approximately 58% of the 2013 provision), an increase for
indemnifications and specific private investor demands
(approximately 8%) and new loan sales (approximately 34%).
Our provision in 2012 reflected an increase in projections of
future GSE repurchase demands, net of appeals, for the pre-
2009 vintages to incorporate the impact of trends in file requests
and repurchase demand activity (comprising approximately 58%
of the 2012 provision), an increase in probable loss estimates for
mortgage insurance rescissions (approximately 10%), new loan
sales (approximately 14%), an increase in probable loss
estimates for non-agency risk (approximately 9%), and various
other observed trends affecting our repurchase liability including
higher than anticipated loss severity (approximately 9%). The
increase in projected future GSE repurchase demands in 2012
was predominantly a result of an increase in the expected file
reviews by the GSEs as well as an increase in observed demand
rates on these file reviews based on our experience with them at
that time.
The mortgage repurchase liability of $899 million at
December 31, 2013, represents our best estimate of the probable
loss that we expect to incur for various representations and
warranties in the contractual provisions of our sales of mortgage
loans. The mortgage repurchase liability estimation process
requires management to make difficult, subjective and complex
judgments about matters that are inherently uncertain,
including demand expectations, economic factors, and the
specific characteristics of the loans subject to repurchase. Our
evaluation considers all vintages and the collective actions of the
GSEs and their regulator, the Federal Housing Finance Agency
(FHFA), mortgage insurers and our correspondent lenders. We
maintain regular contact with the GSEs, the FHFA, and other
significant investors to monitor their repurchase demand
practices and issues as part of our process to update our
repurchase liability estimate as new information becomes
available.
Because of the uncertainty in the various estimates
underlying the mortgage repurchase liability, there is a range of
losses in excess of the recorded mortgage repurchase liability
that are reasonably possible. The estimate of the range of
possible loss for representations and warranties does not
represent a probable loss, and is based on currently available
information, significant judgment, and a number of assumptions
that are subject to change. The high end of this range of
reasonably possible losses in excess of our recorded liability was
$896 million at December 31, 2013, and was determined based
upon modifying the assumptions (particularly to assume
significant changes in investor repurchase demand practices)
utilized in our best estimate of probable loss to reflect what we
believe to be the high end of reasonably possible adverse
assumptions. For additional information on our repurchase
liability, see the “Critical Accounting Policies – Liability for
Mortgage Loan Repurchase Losses” section and Note 9
(Mortgage Banking Activities) to Financial Statements in this
Report.
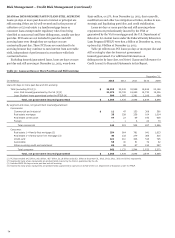
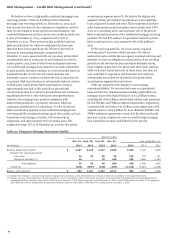
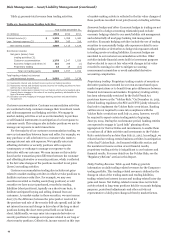
Table 41: Mortgage Repurchase Liability - Sensitivity
Assumptions
(in millions)
Mortgage
repurchase
liability
Balance at December 31, 2013 $ 899
Loss on repurchases (1) 28.3 %
Increase in liability from:
10% higher losses $ 80
25% higher losses 200
Repurchase rate assumption (2) 0.2 %
Increase in liability from:
10% higher repurchase rates $ 65
25% higher repurchase rates 162
(1) Represents total estimated average loss rate on repurchased loans, net of
recovery from third party originators, based on historical experience and current
economic conditions. The average loss rate includes the impact of repurchased
loans for which no loss is expected to be realized.
(2) Represents the combination of the estimated investor audit/file review rate, the
investor demand rate on those audited loans, and the unsuccessful appeal rate on
those demands. As such, the repurchase rate can be significantly impacted by
changes in investor behavior if they decide to review/audit more loans or demand
more repurchases on the loans they audit. These behavior changes drive a
significant component of our estimated high end of the range of reasonably
possible losses in excess of our recorded repurchase liability, which includes
adverse assumptions in excess of the sensitivity ranges presented in this table.
To the extent that economic conditions and the housing
market do not recover or future investor repurchase demands
and appeals success rates differ from past experience, we could
continue to have increased demands and increased loss severity
on repurchases, causing future additions to the repurchase
liability. However, some of the underwriting standards that were
permitted by the GSEs for conforming loans in the 2006 through
2008 vintages, which significantly contributed to recent levels of
repurchase demands, were tightened starting in mid to late 2008
and as of December 31, 2013, we have resolved substantially all
of our repurchase exposures on the pre-2009 vintages with
FNMA and FHLMC. Given the tightening of underwriting
standards in late 2008, we do not expect a similar rate of
repurchase requests from the 2009 and prospective vintages,
absent deterioration in economic conditions or changes in
investor behavior.
RISKS RELATING TO SERVICING ACTIVITIES In addition to
servicing loans in our portfolio, we act as servicer and/or master
servicer of residential mortgage loans included in GSE-
guaranteed mortgage securitizations, GNMA-guaranteed
mortgage securitizations of FHA-insured/VA-guaranteed
mortgages and private label mortgage securitizations, as well as
for unsecuritized loans owned by institutional investors. The
following discussion summarizes the primary duties and
requirements of servicing and related industry developments.
81