Wells Fargo 2013 Annual Report Download - page 226
Download and view the complete annual report
Please find page 226 of the 2013 Wells Fargo annual report below. You can navigate through the pages in the report by either clicking on the pages listed below, or by using the keyword search tool below to find specific information within the annual report.-
 1
1 -
2
-
3
-
4
-
5
-
6
-
7
-
8
-
9
-
10
-
11
-
12
-
13
-
14
-
15
-
16
-
17
-
18
-
19
-
20
-
21
-
22
-
23
-
24
-
25
-
26
-
27
-
28
-
29
-
30
-
31
-
32
-
33
-
34
-
35
-
36
-
37
-
38
-
39
-
40
-
41
-
42
-
43
-
44
-
45
-
46
-
47
-
48
-
49
-
50
-
51
-
52
-
53
-
54
-
55
-
56
-
57
-
58
-
59
-
60
-
61
-
62
-
63
-
64
-
65
-
66
-
67
-
68
-
69
-
70
-
71
-
72
-
73
-
74
-
75
-
76
-
77
-
78
-
79
-
80
-
81
-
82
-
83
-
84
-
85
-
86
-
87
-
88
-
89
-
90
-
91
-
92
-
93
-
94
-
95
-
96
-
97
-
98
-
99
-
100
-
101
-
102
-
103
-
104
-
105
-
106
-
107
-
108
-
109
-
110
-
111
-
112
-
113
-
114
-
115
-
116
-
117
-
118
-
119
-
120
-
121
-
122
-
123
-
124
-
125
-
126
-
127
-
128
-
129
-
130
-
131
-
132
-
133
-
134
-
135
-
136
-
137
-
138
-
139
-
140
-
141
-
142
-
143
-
144
-
145
-
146
-
147
-
148
-
149
-
150
-
151
-
152
-
153
-
154
-
155
-
156
-
157
-
158
-
159
-
160
-
161
-
162
-
163
-
164
-
165
-
166
-
167
-
168
-
169
-
170
-
171
-
172
-
173
-
174
-
175
-
176
-
177
-
178
-
179
-
180
-
181
-
182
-
183
-
184
-
185
-
186
-
187
-
188
-
189
-
190
-
191
-
192
-
193
-
194
-
195
-
196
-
197
-
198
-
199
-
200
-
201
-
202
-
203
-
204
-
205
-
206
-
207
-
208
-
209
-
210
-
211
-
212
-
213
-
214
-
215
-
 216
216 -
 217
217 -
 218
218 -
 219
219 -
 220
220 -
 221
221 -
 222
222 -
 223
223 -
 224
224 -
 225
225 -
 226
226 -
 227
227 -
 228
228 -
 229
229 -
 230
230 -
 231
231 -
 232
232 -
 233
233 -
 234
234 -
 235
235 -
 236
236 -
237
-
238
-
239
-
240
-
241
-
242
-
243
-
244
-
245
-
246
-
247
-
248
-
249
-
250
-
251
-
252
-
253
-
254
-
255
-
256
-
257
-
258
-
259
-
260
-
261
-
262
-
263
-
264
-
265
-
266
-
267
-
268
-
269
-
270
-
271
-
272
 |
 |

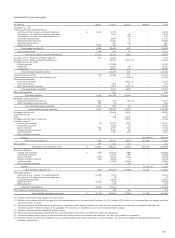
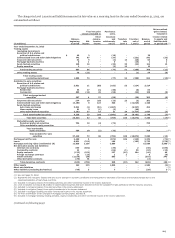
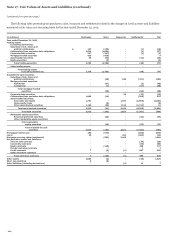
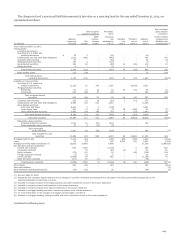
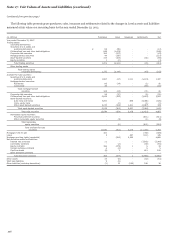
Note 17: Fair Values of Assets and Liabilities (continued)
(continued from previous page)
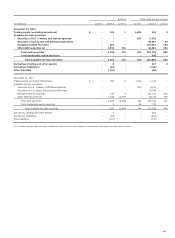
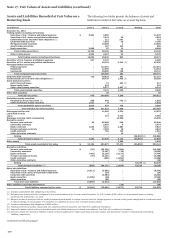
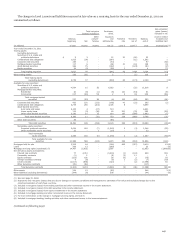
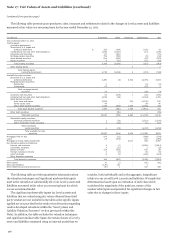
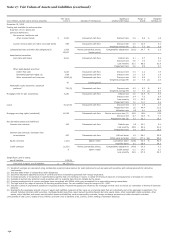
The following table presents gross purchases, sales, issuances and settlements related to the changes in Level 3 assets and liabilities
measured at fair value on a recurring basis for the year ended December 31, 2013.
-
-
-
- -
-
- - -
-
- - - - -
-
-
- -
- -
- -
- -
-
-
- - -
- -
- - - - -
- -
-
-
- -
- - -
- - -
--
- - -
- - - - -
-
-
- -
- -
$
(in millions) Purchases Sales Issuances Settlements Net
Year ended December 31, 2013
Trading assets
(excluding derivatives):
Securities of U.S. states and
political subdivisions 127 (136) (1) (10)
Collateralized loan and other debt obligations 1,030 (1,064) (3) (37)
Corporate debt securities 117 (117) (1) (1)
Mortgage-backed securities 429 (420)9
Asset-backed securities 53 (45) (43) (35)
Equity securities (3) (3)
Total trading securities 1,756 (1,785) (48) (77)
Other trading assets
Total trading assets
(excluding derivatives) 1,756 (1,785) (48) (77)
Available-for-sale securities:
Securities of U.S. states and
political subdivisions (69) 648 (761) (182)
Mortgage-backed securities:
Residential (37) (3) (40)
Commercial (1) (57) (58)
Total mortgage-backed
securities (38) (60) (98)
Corporate debt securities 20 (33) (13)
Collateralized loan and other debt obligations 1,008 (14) (369) 625
Asset-backed securities:
Auto loans and leases 1,751 1,047 (3,865) (1,067)
Home equity loans (5) (5)
Other asset-backed securities 1,164 (36) 1,116 (2,213) 31
Total asset-backed securities 2,915 (41) 2,163 (6,078) (1,041)
Total debt securities 3,923 (162) 2,831 (7,301) (709)
Marketable equity securities:
Perpetual preferred securities (20) (53) (73)
Other marketable equity securities
Total marketable
equity securities (20) (53) (73)
Total available-for-sale
securities 3,923 (182) 2,831 (7,354) (782)
Mortgages held for sale 286 (574) (586) (874)
Loans 23 452 (369) 106
Mortgage servicing rights (residential) (583) 3,469 2,886
Net derivative assets and liabilities:
Interest rate contracts (39) (39)
Commodity contracts (66) (66)
Equity contracts (148) 285 137
Foreign exchange contracts 1 1
Credit contracts 7 (5) (4) 807 805
Other derivative contracts
Total derivative contracts 7 (153) (4) 988 838
Other assets 1,064 (2) (36) 1,026
Short sale liabilities 8 (8)
Other liabilities (excluding derivatives) (4) 11 7
224