Wells Fargo 2013 Annual Report Download - page 262
Download and view the complete annual report
Please find page 262 of the 2013 Wells Fargo annual report below. You can navigate through the pages in the report by either clicking on the pages listed below, or by using the keyword search tool below to find specific information within the annual report.-
 1
1 -
2
-
3
-
4
-
5
-
6
-
7
-
8
-
9
-
10
-
11
-
12
-
13
-
14
-
15
-
16
-
17
-
18
-
19
-
20
-
21
-
22
-
23
-
24
-
25
-
26
-
27
-
28
-
29
-
30
-
31
-
32
-
33
-
34
-
35
-
36
-
37
-
38
-
39
-
40
-
41
-
42
-
43
-
44
-
45
-
46
-
47
-
48
-
49
-
50
-
51
-
52
-
53
-
54
-
55
-
56
-
57
-
58
-
59
-
60
-
61
-
62
-
63
-
64
-
65
-
66
-
67
-
68
-
69
-
70
-
71
-
72
-
73
-
74
-
75
-
76
-
77
-
78
-
79
-
80
-
81
-
82
-
83
-
84
-
85
-
86
-
87
-
88
-
89
-
90
-
91
-
92
-
93
-
94
-
95
-
96
-
97
-
98
-
99
-
100
-
101
-
102
-
103
-
104
-
105
-
106
-
107
-
108
-
109
-
110
-
111
-
112
-
113
-
114
-
115
-
116
-
117
-
118
-
119
-
120
-
121
-
122
-
123
-
124
-
125
-
126
-
127
-
128
-
129
-
130
-
131
-
132
-
133
-
134
-
135
-
136
-
137
-
138
-
139
-
140
-
141
-
142
-
143
-
144
-
145
-
146
-
147
-
148
-
149
-
150
-
151
-
152
-
153
-
154
-
155
-
156
-
157
-
158
-
159
-
160
-
161
-
162
-
163
-
164
-
165
-
166
-
167
-
168
-
169
-
170
-
171
-
172
-
173
-
174
-
175
-
176
-
177
-
178
-
179
-
180
-
181
-
182
-
183
-
184
-
185
-
186
-
187
-
188
-
189
-
190
-
191
-
192
-
193
-
194
-
195
-
196
-
197
-
198
-
199
-
200
-
201
-
202
-
203
-
204
-
205
-
206
-
207
-
208
-
209
-
210
-
211
-
212
-
213
-
214
-
215
-
216
-
217
-
218
-
219
-
220
-
221
-
222
-
223
-
224
-
225
-
226
-
227
-
228
-
229
-
230
-
231
-
232
-
233
-
234
-
235
-
236
-
237
-
238
-
239
-
240
-
241
-
242
-
243
-
244
-
245
-
246
-
247
-
248
-
249
-
250
-
251
-
 252
252 -
 253
253 -
 254
254 -
 255
255 -
 256
256 -
 257
257 -
 258
258 -
 259
259 -
 260
260 -
 261
261 -
 262
262 -
 263
263 -
 264
264 -
 265
265 -
 266
266 -
 267
267 -
 268
268 -
 269
269 -
 270
270 -
 271
271 -
 272
272
 |
 |

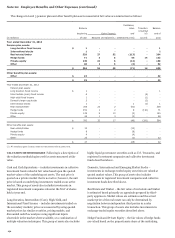
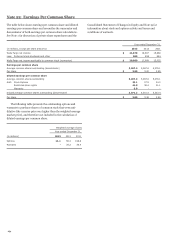
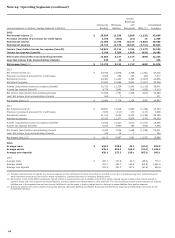
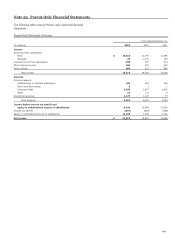
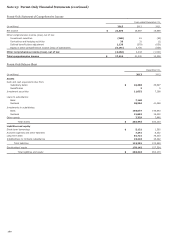
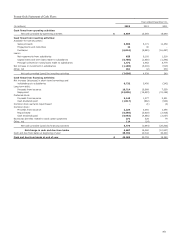
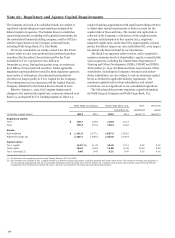
Note 25: Parent-Only Financial Statements (continued)
Parent-Only Statement of Comprehensive Income
Year ended December 31,
(in millions) 2013 2012 2011
Net income $ 21,878 18,897 15,869
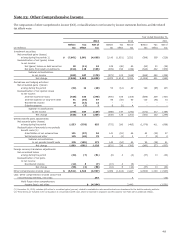
Other comprehensive income (loss), net of tax:
Investment securities (248) 61 (50)
Derivatives and hedging activities 39 31 (1)
Defined benefit plans adjustment 1,136 (379) (650)
Equity in other comprehensive income (loss) of subsidiaries (5,191) 2,730 (830)
Other comprehensive income (loss), net of tax: (4,264) 2,443 (1,531)
Total comprehensive income $ 17,614 21,340 14,338
260
Parent-Only Balance Sheet
December 31,
(in millions) 2013 2012
Assets
Cash and cash equivalents due from:
Subsidiary banks $ 42,386 35,697
Nonaffiliates 3 5
Investment securities 11,652 7,268
Loans to subsidiaries:
Bank 7,140 -
Nonbank 38,504 41,068
Investments in subsidiaries:
Bank 154,577 148,693
Nonbank 21,852 19,492
Other assets 7,329 7,880
Total assets $ 283,443 260,103
Liabilities and equity
Short-term borrowings $ 5,121 1,592
Accrued expenses and other liabilities 7,241 8,332
Long-term debt 81,721 76,233
Indebtedness to nonbank subsidiaries 19,218 16,392
Total liabilities 113,301 102,549
Stockholders' equity 170,142 157,554
Total liabilities and equity $ 283,443 260,103