Wells Fargo 2013 Annual Report Download - page 267
Download and view the complete annual report
Please find page 267 of the 2013 Wells Fargo annual report below. You can navigate through the pages in the report by either clicking on the pages listed below, or by using the keyword search tool below to find specific information within the annual report.-
 1
1 -
2
-
3
-
4
-
5
-
6
-
7
-
8
-
9
-
10
-
11
-
12
-
13
-
14
-
15
-
16
-
17
-
18
-
19
-
20
-
21
-
22
-
23
-
24
-
25
-
26
-
27
-
28
-
29
-
30
-
31
-
32
-
33
-
34
-
35
-
36
-
37
-
38
-
39
-
40
-
41
-
42
-
43
-
44
-
45
-
46
-
47
-
48
-
49
-
50
-
51
-
52
-
53
-
54
-
55
-
56
-
57
-
58
-
59
-
60
-
61
-
62
-
63
-
64
-
65
-
66
-
67
-
68
-
69
-
70
-
71
-
72
-
73
-
74
-
75
-
76
-
77
-
78
-
79
-
80
-
81
-
82
-
83
-
84
-
85
-
86
-
87
-
88
-
89
-
90
-
91
-
92
-
93
-
94
-
95
-
96
-
97
-
98
-
99
-
100
-
101
-
102
-
103
-
104
-
105
-
106
-
107
-
108
-
109
-
110
-
111
-
112
-
113
-
114
-
115
-
116
-
117
-
118
-
119
-
120
-
121
-
122
-
123
-
124
-
125
-
126
-
127
-
128
-
129
-
130
-
131
-
132
-
133
-
134
-
135
-
136
-
137
-
138
-
139
-
140
-
141
-
142
-
143
-
144
-
145
-
146
-
147
-
148
-
149
-
150
-
151
-
152
-
153
-
154
-
155
-
156
-
157
-
158
-
159
-
160
-
161
-
162
-
163
-
164
-
165
-
166
-
167
-
168
-
169
-
170
-
171
-
172
-
173
-
174
-
175
-
176
-
177
-
178
-
179
-
180
-
181
-
182
-
183
-
184
-
185
-
186
-
187
-
188
-
189
-
190
-
191
-
192
-
193
-
194
-
195
-
196
-
197
-
198
-
199
-
200
-
201
-
202
-
203
-
204
-
205
-
206
-
207
-
208
-
209
-
210
-
211
-
212
-
213
-
214
-
215
-
216
-
217
-
218
-
219
-
220
-
221
-
222
-
223
-
224
-
225
-
226
-
227
-
228
-
229
-
230
-
231
-
232
-
233
-
234
-
235
-
236
-
237
-
238
-
239
-
240
-
241
-
242
-
243
-
244
-
245
-
246
-
247
-
248
-
249
-
250
-
251
-
252
-
253
-
254
-
255
-
256
-
 257
257 -
 258
258 -
 259
259 -
 260
260 -
 261
261 -
 262
262 -
 263
263 -
 264
264 -
 265
265 -
 266
266 -
 267
267 -
 268
268 -
 269
269 -
 270
270 -
 271
271 -
 272
272
 |
 |

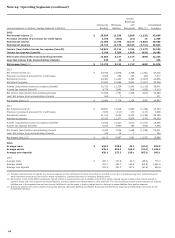
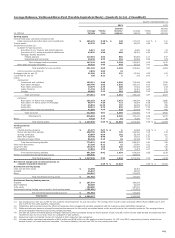
Average Balances, Yields and Rates Paid (Taxable-Equivalent Basis) - Quarterly (1) (2) - (Unaudited)
Quarter ended December 31,
2013 2012
(in millions)
Average
balance
Yields/
rates
Interest
income/
expense
Average
balance
Yields/
rates
Interest
income/
expense
Earning assets
Federal funds sold, securities purchased under
resale agreements and other short-term investments $ 205,276 0.28 % $ 148 117,047 0.41 % $ 121
Trading assets 45,379 3.40 386 42,005 3.28 345
Investment securities (3):
Available-for-sale securities:
Securities of U.S. Treasury and federal agencies 6,611 1.67 27 5,281 1.64 22
Securities of U.S. states and political subdivisions 42,025 4.38 460 36,391 4.64 422
Mortgage-backed securities:
Federal agencies 117,910 2.94 866 90,898 2.71 617
Residential and commercial 29,233 6.35 464 32,669 6.53 533
Total mortgage-backed securities 147,143 3.62 1,330 123,567 3.72 1,150
Other debt and equity securities 55,325 3.43 478 50,025 3.91 490
Total available-for-sale securities 251,104 3.65 2,295 215,264 3.87 2,084
Held-to-maturity securities (4) 2,845 3.09 22 - - -
Mortgages held for sale (5) 21,396 4.13 221 47,241 3.50 413
Loans held for sale (5) 138 8.21 3 135 9.03 3
Loans:
Commercial:
Commercial and industrial 193,211 3.48 1,696 179,493 3.85 1,736
Real estate mortgage 105,795 3.85 1,026 105,107 4.02 1,061
Real estate construction 16,579 4.79 200 17,502 4.97 218
Lease financing 11,744 5.70 167 12,461 6.43 201
Foreign 46,682 2.23 262 39,665 2.32 231
Total commercial 374,011 3.56 3,351 354,228 3.87 3,447
Consumer:
Real estate 1-4 family first mortgage 257,253 4.15 2,673 244,634 4.39 2,686
Real estate 1-4 family junior lien mortgage 66,774 4.29 721 76,908 4.28 826
Credit card 25,854 12.23 797 23,839 12.43 745
Automobile 50,213 6.70 849 45,957 7.34 848
Other revolving credit and installment 42,564 4.94 529 41,644 4.63 485
Total consumer 442,658 5.01 5,569 432,982 5.15 5,590
Total loans (5) 816,669 4.35 8,920 787,210 9,037
Other 4,728 5.22 61 4,280
4.58
5.21 56
Total earning assets $ 1,347,535 3.56 % $ 12,056 1,213,182 3.96 % $ 12,059
Funding sources
Deposits:
Interest-bearing checking $ 35,171 0.07 % $ 6 30,858 0.06 % $ 5
Market rate and other savings 568,750 0.08 110 518,593 0.10 135
Savings certificates 43,067 0.94 102 56,743 1.27 181
Other time deposits 39,700 0.48 47 13,612 1.51 51
Deposits in foreign offices 86,333 0.15 32 69,398 0.15 27
Total interest-bearing deposits 773,021 0.15 297 689,204 0.23 399
Short-term borrowings 52,286 0.12 15 52,820 0.21 28
Long-term debt 153,470 1.65 635 127,505 2.30 735
Other liabilities 12,822 2.70 87 9,975 2.27 56
Total interest-bearing liabilities 991,599 0.42 1,034 879,504 0.55 1,218
Portion of noninterest-bearing funding sources 355,936 - - 333,678 - -
Total funding sources $ 1,347,535 0.30 1,034 1,213,182 0.40 1,218
Net interest margin and net interest income on
a taxable-equivalent basis (6) 3.26 % $ 11,022 3.56 % $ 10,841
Noninterest-earning assets
Cash and due from banks $ 15,998 16,361
Goodwill 25,637 25,637
Other 119,947 131,876
Total noninterest-earning assets $ 161,582 173,874
Noninterest-bearing funding sources
Deposits $ 287,379 286,924
Other liabilities 60,489 63,025
Total equity 169,650 157,603
Noninterest-bearing funding sources used to fund earning assets (355,936) (333,678)
Net noninterest-bearing funding sources $ 161,582 173,874
Total assets $ 1,509,117 1,387,056
(1) Our average prime rate was 3.25% for the quarters ended December 31, 2013 and 2012. The average three-month London Interbank Offered Rate (LIBOR) was 0.24%
and 0.32% for the same quarters, respectively.
(2) Yields/rates and amounts include the effects of hedge and risk management activities associated with the respective asset and liability categories.
(3) Yields and rates are based on interest income/expense amounts for the period, annualized based on the accrual basis for the respective accounts. The average balance
amounts represent amortized cost for the periods presented.
(4) Includes $6.3 billion of federal agency mortgage-backed securities purchased during the fourth quarter of 2013 and $6.0 billion of auto asset-backed securities that were
transferred near the end of 2013 from the available-for-sale portfolio.
(5) Nonaccrual loans and related income are included in their respective loan categories.
(6) Includes taxable-equivalent adjustments of $219 million and $198 million for the quarters ended December 31, 2013 and 2012, respectively primarily related to tax-
exempt income on certain loans and securities. The federal statutory tax rate was 35% for the periods presented.
265