Wells Fargo 2013 Annual Report Download - page 191
Download and view the complete annual report
Please find page 191 of the 2013 Wells Fargo annual report below. You can navigate through the pages in the report by either clicking on the pages listed below, or by using the keyword search tool below to find specific information within the annual report.-
 1
1 -
2
-
3
-
4
-
5
-
6
-
7
-
8
-
9
-
10
-
11
-
12
-
13
-
14
-
15
-
16
-
17
-
18
-
19
-
20
-
21
-
22
-
23
-
24
-
25
-
26
-
27
-
28
-
29
-
30
-
31
-
32
-
33
-
34
-
35
-
36
-
37
-
38
-
39
-
40
-
41
-
42
-
43
-
44
-
45
-
46
-
47
-
48
-
49
-
50
-
51
-
52
-
53
-
54
-
55
-
56
-
57
-
58
-
59
-
60
-
61
-
62
-
63
-
64
-
65
-
66
-
67
-
68
-
69
-
70
-
71
-
72
-
73
-
74
-
75
-
76
-
77
-
78
-
79
-
80
-
81
-
82
-
83
-
84
-
85
-
86
-
87
-
88
-
89
-
90
-
91
-
92
-
93
-
94
-
95
-
96
-
97
-
98
-
99
-
100
-
101
-
102
-
103
-
104
-
105
-
106
-
107
-
108
-
109
-
110
-
111
-
112
-
113
-
114
-
115
-
116
-
117
-
118
-
119
-
120
-
121
-
122
-
123
-
124
-
125
-
126
-
127
-
128
-
129
-
130
-
131
-
132
-
133
-
134
-
135
-
136
-
137
-
138
-
139
-
140
-
141
-
142
-
143
-
144
-
145
-
146
-
147
-
148
-
149
-
150
-
151
-
152
-
153
-
154
-
155
-
156
-
157
-
158
-
159
-
160
-
161
-
162
-
163
-
164
-
165
-
166
-
167
-
168
-
169
-
170
-
171
-
172
-
173
-
174
-
175
-
176
-
177
-
178
-
179
-
180
-
 181
181 -
 182
182 -
 183
183 -
 184
184 -
 185
185 -
 186
186 -
 187
187 -
 188
188 -
 189
189 -
 190
190 -
 191
191 -
 192
192 -
 193
193 -
 194
194 -
 195
195 -
 196
196 -
 197
197 -
 198
198 -
 199
199 -
 200
200 -
 201
201 -
202
-
203
-
204
-
205
-
206
-
207
-
208
-
209
-
210
-
211
-
212
-
213
-
214
-
215
-
216
-
217
-
218
-
219
-
220
-
221
-
222
-
223
-
224
-
225
-
226
-
227
-
228
-
229
-
230
-
231
-
232
-
233
-
234
-
235
-
236
-
237
-
238
-
239
-
240
-
241
-
242
-
243
-
244
-
245
-
246
-
247
-
248
-
249
-
250
-
251
-
252
-
253
-
254
-
255
-
256
-
257
-
258
-
259
-
260
-
261
-
262
-
263
-
264
-
265
-
266
-
267
-
268
-
269
-
270
-
271
-
272
 |
 |

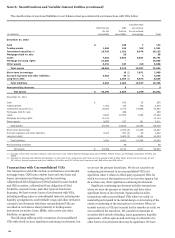
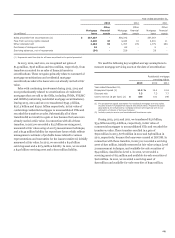
Year ended December 31,
2013 2012 2011
(in millions)
Mortgage
loans
Other
financial
assets
Mortgage
loans
Other
financial
assets
Mortgage
loans
Other
financial
assets
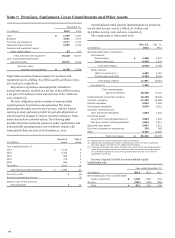
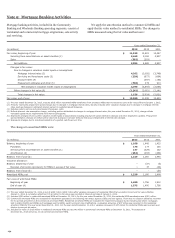
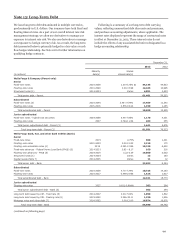
Sales proceeds from securitizations (1) $ 357,807 -535,372 - 337,357 -
Fees from servicing rights retained 4,240 10 4,433 10 4,401 11
Other interests held 2,284 93 1,767 135 1,779 263
Purchases of delinquent assets 18 -62 - 9 -
Servicing advances, net of repayments (34) - 226 - 29 -
(1) Represents cash flow data for all loans securitized in the period presented.
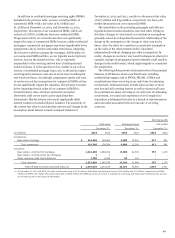
In 2013, 2012, and 2011, we recognized net gains of
$149 million, $518 million and $112 million, respectively, from
transfers accounted for as sales of financial assets in
securitizations. These net gains primarily relate to commercial
mortgage securitizations and residential mortgage
securitizations where the loans were not already carried at fair
value.
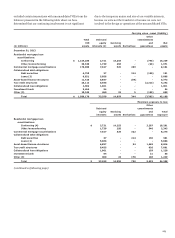
Sales with continuing involvement during 2013, 2012 and
2011 predominantly related to securitizations of residential
mortgages that are sold to the GSEs, including FNMA, FHLMC
and GNMA (conforming residential mortgage securitizations).
During 2013, 2012 and 2011 we transferred $343.9 billion,
$517.3 billion and $329.1 billion respectively, in fair value of
conforming residential mortgages to unconsolidated VIEs and
recorded the transfers as sales. Substantially all of these
transfers did not result in a gain or loss because the loans were
already carried at fair value. In connection with all of these
transfers, in 2013 we recorded a $3.5 billion servicing asset,
measured at fair value using a Level 3 measurement technique,
and a $143 million liability for repurchase losses which reflects
management’s estimate of probable losses related to various
representations and warranties for the loans transferred, initially
measured at fair value. In 2012, we recorded a $4.9 billion
servicing asset and a $274 million liability. In 2011, we recorded
a $4.0 billion servicing asset and a $101 million liability.
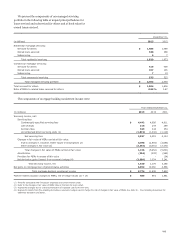
We used the following key weighted-average assumptions to
measure mortgage servicing assets at the date of securitization:
Residential mortgage
servicing rights
Year ended December 31,
2013 2012 2011
Prepayment speed (1) 11.2 % 13.4 12.8
Discount rate 7.3 7.3 7.7
Cost to service ($ per loan) (2) $ 184 151 146
(1) The prepayment speed assumption for residential mortgage servicing rights
includes a blend of prepayment speeds and default rates. Prepayment speed
assumptions are influenced by mortgage interest rate inputs as well as our
estimation of drivers of borrower behavior.
(2) Includes costs to service and unreimbursed foreclosure costs.
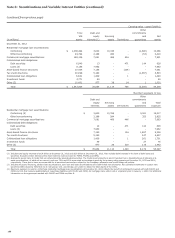
During 2013, 2012 and 2011, we transferred $5.6 billion,
$3.4 billion and $3.0 billion, respectively, in fair value of
commercial mortgages to unconsolidated VIEs and recorded the
transfers as sales. These transfers resulted in a gain of
$152 million in 2013, $178 million in 2012 and $48 million in
2011, respectively, because the loans were carried at LOCOM. In
connection with these transfers, in 2013 we recorded a servicing
asset of $20 million, initially measured at fair value using a Level
3 measurement technique, and available-for-sale securities of
$54 million, classified as Level 2. In 2012, we recorded a
servicing asset of $13 million and available-for-sale securities of
$116 million. In 2011, we recorded a servicing asset of
$20 million and available-for-sale securities of $532 million.
189