Wells Fargo 2013 Annual Report Download - page 260
Download and view the complete annual report
Please find page 260 of the 2013 Wells Fargo annual report below. You can navigate through the pages in the report by either clicking on the pages listed below, or by using the keyword search tool below to find specific information within the annual report.-
 1
1 -
2
-
3
-
4
-
5
-
6
-
7
-
8
-
9
-
10
-
11
-
12
-
13
-
14
-
15
-
16
-
17
-
18
-
19
-
20
-
21
-
22
-
23
-
24
-
25
-
26
-
27
-
28
-
29
-
30
-
31
-
32
-
33
-
34
-
35
-
36
-
37
-
38
-
39
-
40
-
41
-
42
-
43
-
44
-
45
-
46
-
47
-
48
-
49
-
50
-
51
-
52
-
53
-
54
-
55
-
56
-
57
-
58
-
59
-
60
-
61
-
62
-
63
-
64
-
65
-
66
-
67
-
68
-
69
-
70
-
71
-
72
-
73
-
74
-
75
-
76
-
77
-
78
-
79
-
80
-
81
-
82
-
83
-
84
-
85
-
86
-
87
-
88
-
89
-
90
-
91
-
92
-
93
-
94
-
95
-
96
-
97
-
98
-
99
-
100
-
101
-
102
-
103
-
104
-
105
-
106
-
107
-
108
-
109
-
110
-
111
-
112
-
113
-
114
-
115
-
116
-
117
-
118
-
119
-
120
-
121
-
122
-
123
-
124
-
125
-
126
-
127
-
128
-
129
-
130
-
131
-
132
-
133
-
134
-
135
-
136
-
137
-
138
-
139
-
140
-
141
-
142
-
143
-
144
-
145
-
146
-
147
-
148
-
149
-
150
-
151
-
152
-
153
-
154
-
155
-
156
-
157
-
158
-
159
-
160
-
161
-
162
-
163
-
164
-
165
-
166
-
167
-
168
-
169
-
170
-
171
-
172
-
173
-
174
-
175
-
176
-
177
-
178
-
179
-
180
-
181
-
182
-
183
-
184
-
185
-
186
-
187
-
188
-
189
-
190
-
191
-
192
-
193
-
194
-
195
-
196
-
197
-
198
-
199
-
200
-
201
-
202
-
203
-
204
-
205
-
206
-
207
-
208
-
209
-
210
-
211
-
212
-
213
-
214
-
215
-
216
-
217
-
218
-
219
-
220
-
221
-
222
-
223
-
224
-
225
-
226
-
227
-
228
-
229
-
230
-
231
-
232
-
233
-
234
-
235
-
236
-
237
-
238
-
239
-
240
-
241
-
242
-
243
-
244
-
245
-
246
-
247
-
248
-
249
-
 250
250 -
 251
251 -
 252
252 -
 253
253 -
 254
254 -
 255
255 -
 256
256 -
 257
257 -
 258
258 -
 259
259 -
 260
260 -
 261
261 -
 262
262 -
 263
263 -
 264
264 -
 265
265 -
 266
266 -
 267
267 -
 268
268 -
 269
269 -
 270
270 -
271
-
272
 |
 |

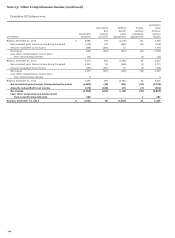
Note 24: Operating Segments (continued)
(income/expense in millions, average balances in billions)
Community
Banking
Wholesale
Banking
Wealth,
Brokerage
and
Retirement Other (1)
Consolidated
Company
2013
Net interest income (2) $ 28,839 12,298 2,888 (1,225) 42,800
Provision (reversal of provision) for credit losses 2,755 (445) (16) 15 2,309
Noninterest income 21,500 11,766 10,315 (2,601) 40,980
Noninterest expense 28,723 12,378 10,455 (2,714) 48,842
Income (loss) before income tax expense (benefit) 18,861 12,131 2,764 (1,127) 32,629
Income tax expense (benefit) 5,799 3,984 1,050 (428) 10,405
Net income (loss) before noncontrolling interests 13,062 8,147 1,714 (699) 22,224
Less: Net income from noncontrolling interests 330 14 2 - 346
Net income (loss) (3) $ 12,732 8,133 1,712 (699) 21,878
2012
Net interest income (2) $ 29,045 12,648 2,768 (1,231) 43,230
Provision (reversal of provision) for credit losses 6,835 286 125 (29) 7,217
Noninterest income 24,360 11,444 9,392 (2,340) 42,856
Noninterest expense 30,840 12,082 9,893 (2,417) 50,398
Income (loss) before income tax expense (benefit) 15,730 11,724 2,142 (1,125) 28,471
Income tax expense (benefit) 4,774 3,943 814 (428) 9,103
Net income (loss) before noncontrolling interests 10,956 7,781 1,328 (697) 19,368
Less: Net income from noncontrolling interests 464 7 - - 471
Net income (loss) (3) $ 10,492 7,774 1,328 (697) 18,897
2011
Net interest income (2) $ 29,657 11,616 2,844 (1,354) 42,763
Provision (reversal of provision) for credit losses 7,976 (110) 170 (137) 7,899
Noninterest income 21,124 9,952 9,333 (2,224) 38,185
Noninterest expense 29,252 11,177 9,934 (970) 49,393
Income (loss) before income tax expense (benefit) 13,553 10,501 2,073 (2,471) 23,656
Income tax expense (benefit) 4,104 3,495 785 (939) 7,445
Net income (loss) before noncontrolling interests 9,449 7,006 1,288 (1,532) 16,211
Less: Net income from noncontrolling interests 316 19 7 - 342
Net income (loss) (3) $ 9,133 6,987 1,281 (1,532) 15,869
2013
Average loans $ 499.3 290.0 46.1 (30.4) 805.0
Average assets 835.4 502.3 180.9 (70.3) 1,448.3
Average core deposits 620.1 237.2 150.1 (65.3) 942.1
2012
Average loans $ 487.1 273.8 42.7 (28.4) 775.2
Average assets 761.1 481.7 164.6 (65.8) 1,341.6
Average core deposits 591.2 227.0 137.5 (61.8) 893.9
(1) Includes corporate items not specific to a business segment and the elimination of certain items that are included in more than one business segment, substantially all of
which represents products and services for wealth management customers provided in Community Banking stores.
(2) Net interest income is the difference between interest earned on assets and the cost of liabilities to fund those assets. Interest earned includes actual interest earned on
segment assets and, if the segment has excess liabilities, interest credits for providing funding to other segments. The cost of liabilities includes interest expense on segment
liabilities and, if the segment does not have enough liabilities to fund its assets, a funding charge based on the cost of excess liabilities from another segment.
(3) Represents segment net income (loss) for Community Banking; Wholesale Banking; and Wealth, Brokerage and Retirement segments and Wells Fargo net income for the
consolidated company.
258