Wells Fargo 2013 Annual Report Download - page 62
Download and view the complete annual report
Please find page 62 of the 2013 Wells Fargo annual report below. You can navigate through the pages in the report by either clicking on the pages listed below, or by using the keyword search tool below to find specific information within the annual report.-
 1
1 -
2
-
3
-
4
-
5
-
6
-
7
-
8
-
9
-
10
-
11
-
12
-
13
-
14
-
15
-
16
-
17
-
18
-
19
-
20
-
21
-
22
-
23
-
24
-
25
-
26
-
27
-
28
-
29
-
30
-
31
-
32
-
33
-
34
-
35
-
36
-
37
-
38
-
39
-
40
-
41
-
42
-
43
-
44
-
45
-
46
-
47
-
48
-
49
-
50
-
51
-
 52
52 -
 53
53 -
 54
54 -
 55
55 -
 56
56 -
 57
57 -
 58
58 -
 59
59 -
 60
60 -
 61
61 -
 62
62 -
 63
63 -
 64
64 -
 65
65 -
 66
66 -
 67
67 -
 68
68 -
 69
69 -
 70
70 -
 71
71 -
 72
72 -
73
-
74
-
75
-
76
-
77
-
78
-
79
-
80
-
81
-
82
-
83
-
84
-
85
-
86
-
87
-
88
-
89
-
90
-
91
-
92
-
93
-
94
-
95
-
96
-
97
-
98
-
99
-
100
-
101
-
102
-
103
-
104
-
105
-
106
-
107
-
108
-
109
-
110
-
111
-
112
-
113
-
114
-
115
-
116
-
117
-
118
-
119
-
120
-
121
-
122
-
123
-
124
-
125
-
126
-
127
-
128
-
129
-
130
-
131
-
132
-
133
-
134
-
135
-
136
-
137
-
138
-
139
-
140
-
141
-
142
-
143
-
144
-
145
-
146
-
147
-
148
-
149
-
150
-
151
-
152
-
153
-
154
-
155
-
156
-
157
-
158
-
159
-
160
-
161
-
162
-
163
-
164
-
165
-
166
-
167
-
168
-
169
-
170
-
171
-
172
-
173
-
174
-
175
-
176
-
177
-
178
-
179
-
180
-
181
-
182
-
183
-
184
-
185
-
186
-
187
-
188
-
189
-
190
-
191
-
192
-
193
-
194
-
195
-
196
-
197
-
198
-
199
-
200
-
201
-
202
-
203
-
204
-
205
-
206
-
207
-
208
-
209
-
210
-
211
-
212
-
213
-
214
-
215
-
216
-
217
-
218
-
219
-
220
-
221
-
222
-
223
-
224
-
225
-
226
-
227
-
228
-
229
-
230
-
231
-
232
-
233
-
234
-
235
-
236
-
237
-
238
-
239
-
240
-
241
-
242
-
243
-
244
-
245
-
246
-
247
-
248
-
249
-
250
-
251
-
252
-
253
-
254
-
255
-
256
-
257
-
258
-
259
-
260
-
261
-
262
-
263
-
264
-
265
-
266
-
267
-
268
-
269
-
270
-
271
-
272
 |
 |
Risk Management – Credit Risk Management (continued)
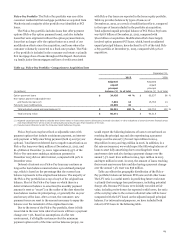
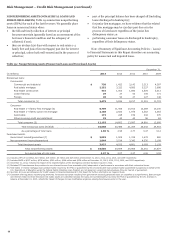
FOREIGN LOANS AND COUNTRY RISK EXPOSURE We
classify loans for financial statement and certain regulatory
purposes as foreign primarily based on whether the borrower’s
primary address is outside of the United States. At
December 31, 2013, foreign loans totaled $47.7 billion,
representing approximately 6% of our total consolidated loans
outstanding, compared with $37.8 billion, or approximately 5%
of total consolidated loans outstanding, at December 31, 2012.
A significant portion of the growth in foreign loans was due to
the acquisition of CRE loans in the U.K. in third quarter 2013.
Foreign loans were approximately 3% of our consolidated total
assets at December 31, 2013 and at December 31, 2012.
Our foreign country risk monitoring process incorporates
frequent dialogue with our financial institution customers,
counterparties and regulatory agencies, enhanced by
centralized monitoring of macroeconomic and capital markets
conditions in the respective countries. We establish exposure
limits for each country through a centralized oversight process
based on customer needs, and in consideration of relevant
economic, political, social, legal, and transfer risks. We monitor
exposures closely and adjust our country limits in response to
changing conditions.
We evaluate our individual country risk exposure on an
ultimate country of risk basis, which is normally based on the
country of residence of the guarantor or collateral location, and
is different from the reporting based on the borrower’s primary
address. Our largest single foreign country exposure on an
ultimate risk basis at December 31, 2013, was the United
Kingdom, which totaled $21.1 billion, or approximately 1% of
our total assets, and included $3.0 billion of sovereign claims.
Our United Kingdom sovereign claims arise primarily from
deposits we have placed with the Bank of England pursuant to
regulatory requirements in support of our London branch.
We conduct periodic stress tests of our significant country
risk exposures, analyzing the direct and indirect impacts on the
risk of loss from various macroeconomic and capital markets
scenarios. We do not have significant exposure to foreign
country risks because our foreign portfolio is relatively small.
However, we have identified exposure to increased loss from
U.S. borrowers associated with the potential impact of a
regional or worldwide economic downturn on the U.S.
economy. We mitigate these potential impacts on the risk of
loss through our normal risk management processes which
include active monitoring and, if necessary, the application of
aggressive loss mitigation strategies.
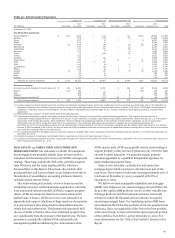
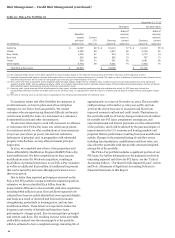
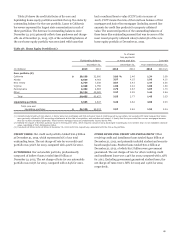
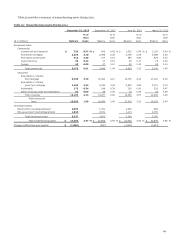
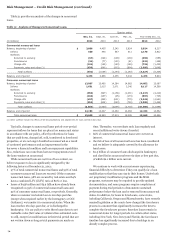
Table 22 provides information regarding our top 20
exposures by country (excluding the U.S.) and our Eurozone
exposure, on an ultimate risk basis.
60