Wells Fargo 2013 Annual Report Download - page 44
Download and view the complete annual report
Please find page 44 of the 2013 Wells Fargo annual report below. You can navigate through the pages in the report by either clicking on the pages listed below, or by using the keyword search tool below to find specific information within the annual report.-
 1
1 -
2
-
3
-
4
-
5
-
6
-
7
-
8
-
9
-
10
-
11
-
12
-
13
-
14
-
15
-
16
-
17
-
18
-
19
-
20
-
21
-
22
-
23
-
24
-
25
-
26
-
27
-
28
-
29
-
30
-
31
-
32
-
33
-
 34
34 -
 35
35 -
 36
36 -
 37
37 -
 38
38 -
 39
39 -
 40
40 -
 41
41 -
 42
42 -
 43
43 -
 44
44 -
 45
45 -
 46
46 -
 47
47 -
 48
48 -
 49
49 -
 50
50 -
 51
51 -
 52
52 -
 53
53 -
 54
54 -
55
-
56
-
57
-
58
-
59
-
60
-
61
-
62
-
63
-
64
-
65
-
66
-
67
-
68
-
69
-
70
-
71
-
72
-
73
-
74
-
75
-
76
-
77
-
78
-
79
-
80
-
81
-
82
-
83
-
84
-
85
-
86
-
87
-
88
-
89
-
90
-
91
-
92
-
93
-
94
-
95
-
96
-
97
-
98
-
99
-
100
-
101
-
102
-
103
-
104
-
105
-
106
-
107
-
108
-
109
-
110
-
111
-
112
-
113
-
114
-
115
-
116
-
117
-
118
-
119
-
120
-
121
-
122
-
123
-
124
-
125
-
126
-
127
-
128
-
129
-
130
-
131
-
132
-
133
-
134
-
135
-
136
-
137
-
138
-
139
-
140
-
141
-
142
-
143
-
144
-
145
-
146
-
147
-
148
-
149
-
150
-
151
-
152
-
153
-
154
-
155
-
156
-
157
-
158
-
159
-
160
-
161
-
162
-
163
-
164
-
165
-
166
-
167
-
168
-
169
-
170
-
171
-
172
-
173
-
174
-
175
-
176
-
177
-
178
-
179
-
180
-
181
-
182
-
183
-
184
-
185
-
186
-
187
-
188
-
189
-
190
-
191
-
192
-
193
-
194
-
195
-
196
-
197
-
198
-
199
-
200
-
201
-
202
-
203
-
204
-
205
-
206
-
207
-
208
-
209
-
210
-
211
-
212
-
213
-
214
-
215
-
216
-
217
-
218
-
219
-
220
-
221
-
222
-
223
-
224
-
225
-
226
-
227
-
228
-
229
-
230
-
231
-
232
-
233
-
234
-
235
-
236
-
237
-
238
-
239
-
240
-
241
-
242
-
243
-
244
-
245
-
246
-
247
-
248
-
249
-
250
-
251
-
252
-
253
-
254
-
255
-
256
-
257
-
258
-
259
-
260
-
261
-
262
-
263
-
264
-
265
-
266
-
267
-
268
-
269
-
270
-
271
-
272
 |
 |
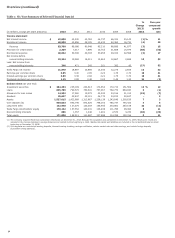
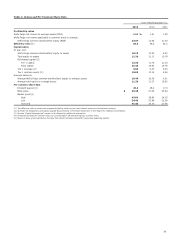
Earnings Performance (continued)
$3.6 billion hedge gain), and net servicing income of $3.3 billion
for 2011 included a $1.6 billion net MSR valuation gain
($3.7 billion decrease in the fair value of MSRs offset by a
$5.3 billion hedge gain). The decrease in the 2012 net MSR
valuation gain from that for 2011 reflected a $677 million
reduction in valuation due to additional costs associated with
implementation of the servicing standards developed in
connection with our settlement with the Department of Justice
(DOJ) and other state and federal agencies relating to our
mortgage servicing and foreclosure practices as well as higher
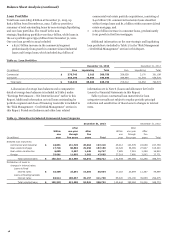
foreclosure costs. Our portfolio of loans serviced for others was
$1.90 trillion at December 31, 2013, $1.91 trillion at
December 31, 2012, and $1.85 trillion at December 31, 2011. At
December 31, 2013, the ratio of MSRs to related loans serviced
for others was 0.88%, compared with 0.67% at
December 31, 2012 and 0.76% at December 31, 2011. See the
“Risk Management – Mortgage Banking Interest Rate and
Market Risk” section in this Report for additional information
regarding our MSRs risks and hedging approach.
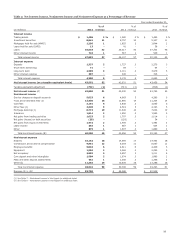
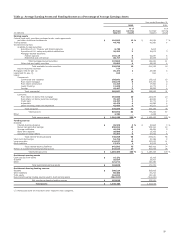
Net gains on mortgage loan origination/sale activities were
$6.9 billion in 2013, compared with $10.3 billion in 2012 and
$4.6 billion in 2011. The decrease from 2012 was primarily
driven by lower margins and origination volumes, and the
increase in 2012 from 2011 was driven by higher loan origination
volume and margins. Mortgage loan originations were
$351 billion in 2013, of which 47% were for home purchases,
compared with $524 billion and 35%, respectively, for 2012 and
$357 billion and 40%, respectively, for 2011. During 2013, we
retained for investment $3.6 billion ($19.4 billion for 2012) of
1-4 family conforming first mortgage loans, forgoing
approximately $120 million ($575 million for 2012) of revenue
that could have been generated had the loans been originated for
sale along with other agency conforming loan production. While
retaining these mortgage loans on our balance sheet reduced
mortgage revenue, we expect to generate spread income in
future quarters from mortgage loans with higher yields than
mortgage-backed securities we could have purchased in the
market. While we do not currently plan to hold additional
conforming mortgages on balance sheet, we have a large
mortgage business and strong capital that provides us with the
flexibility to make such choices in the future to benefit our long-
term results. Mortgage applications were $438 billion in 2013,
compared with $736 billion in 2012 and $537 billion in 2011.
The 1-4 family first mortgage unclosed pipeline was $25 billion
at December 31, 2013, compared with $81 billion at
December 31, 2012 and $72 billion at December 31, 2011. For
additional information about our mortgage banking activities
and results, see the “Risk Management – Mortgage Banking
Interest Rate and Market Risk” section and Note 9 (Mortgage
Banking Activities) and Note 17 (Fair Values of Assets and
Liabilities) to Financial Statements in this Report.
Net gains on mortgage loan origination/sales activities
include the cost of additions to the mortgage repurchase liability.
Mortgage loans are repurchased from third parties based on
standard representations and warranties, and early payment
default clauses in mortgage sale contracts. Additions to the
mortgage repurchase liability that were charged against net
gains on mortgage loan origination/sales activities during 2013
totaled $428 million (compared with $1.9 billion for 2012 and
$1.3 billion for 2011), of which $285 million ($1.7 billion for
2012 and $1.2 billion for 2011) was for subsequent increases in
estimated losses on prior period loan sales. In September and
December 2013, we announced agreements with Federal Home
Loan Mortgage Corporation (FHLMC) and Federal National
Mortgage Association (FNMA), respectively, which resolved
substantially all agency repurchase liabilities for mortgage loans
sold or originated prior to 2009. As a result, outstanding
repurchase demands were down $1.2 billion from a year ago and
our repurchase liability declined to $899 million, the lowest level
since second quarter 2009. For additional information about
mortgage loan repurchases, see the “Risk Management – Credit
Risk Management – Liability for Mortgage Loan Repurchase
Losses” section and Note 9 (Mortgage Banking Activities) to
Financial Statements in this Report.
We engage in trading activities primarily to accommodate the
investment activities of our customers, execute economic
hedging to manage certain of our balance sheet risks and for a
very limited amount of proprietary trading for our own account.
Net gains (losses) from trading activities, which reflect
unrealized changes in fair value of our trading positions and
realized gains and losses, were $1.6 billion in 2013, $1.7 billion
in 2012 and $1.0 billion in 2011. The year-over-year decrease in
2013 was largely driven by lower results in customer
accommodation, and the increase in 2012 from 2011 was driven
by gains on customer accommodation trading activities and
economic hedging gains, which included higher gains on
deferred compensation plan investments based on participant
elections (offset entirely in employee benefit expense). Net gains
from trading activities do not include interest and dividend
income and expense on trading securities. Those amounts are
reported within interest income from trading assets and other
interest expense from trading liabilities. Proprietary trading
generated $13 million and $15 million of net gains in 2013 and
2012, respectively, and $14 million of net losses in 2011. Interest
and fees related to proprietary trading are reported in their
corresponding income statement line items. Proprietary trading
activities are not significant to our client-focused business
model. For additional information about proprietary and other
trading, see the “Risk Management – Asset and Liability
Management – Market Risk – Trading Activities” section in this
Report.
Net gains on debt and equity securities totaled $1.4 billion for
both 2013 and 2012 and $1.5 billion for 2011, after other-than-
temporary impairment (OTTI) write-downs of $344 million,
$416 million and $711 million, respectively, for the same periods.
All other income was $113 million for 2013 compared with
$1.1 billion in 2012 and $1.2 billion in 2011. All other income
includes ineffectiveness recognized on derivatives that qualify
for hedge accounting and pre-tax losses on tax credits and
foreign currency adjustments, any of which can cause other
income losses. Lower other income for 2013 compared with a
year ago reflected larger ineffectiveness losses on derivatives that
qualify for hedge accounting and interest-related valuation
changes on certain mortgage-related assets carried at fair value.
42