Wells Fargo 2013 Annual Report Download - page 59
Download and view the complete annual report
Please find page 59 of the 2013 Wells Fargo annual report below. You can navigate through the pages in the report by either clicking on the pages listed below, or by using the keyword search tool below to find specific information within the annual report.-
 1
1 -
2
-
3
-
4
-
5
-
6
-
7
-
8
-
9
-
10
-
11
-
12
-
13
-
14
-
15
-
16
-
17
-
18
-
19
-
20
-
21
-
22
-
23
-
24
-
25
-
26
-
27
-
28
-
29
-
30
-
31
-
32
-
33
-
34
-
35
-
36
-
37
-
38
-
39
-
40
-
41
-
42
-
43
-
44
-
45
-
46
-
47
-
48
-
 49
49 -
 50
50 -
 51
51 -
 52
52 -
 53
53 -
 54
54 -
 55
55 -
 56
56 -
 57
57 -
 58
58 -
 59
59 -
 60
60 -
 61
61 -
 62
62 -
 63
63 -
 64
64 -
 65
65 -
 66
66 -
 67
67 -
 68
68 -
 69
69 -
70
-
71
-
72
-
73
-
74
-
75
-
76
-
77
-
78
-
79
-
80
-
81
-
82
-
83
-
84
-
85
-
86
-
87
-
88
-
89
-
90
-
91
-
92
-
93
-
94
-
95
-
96
-
97
-
98
-
99
-
100
-
101
-
102
-
103
-
104
-
105
-
106
-
107
-
108
-
109
-
110
-
111
-
112
-
113
-
114
-
115
-
116
-
117
-
118
-
119
-
120
-
121
-
122
-
123
-
124
-
125
-
126
-
127
-
128
-
129
-
130
-
131
-
132
-
133
-
134
-
135
-
136
-
137
-
138
-
139
-
140
-
141
-
142
-
143
-
144
-
145
-
146
-
147
-
148
-
149
-
150
-
151
-
152
-
153
-
154
-
155
-
156
-
157
-
158
-
159
-
160
-
161
-
162
-
163
-
164
-
165
-
166
-
167
-
168
-
169
-
170
-
171
-
172
-
173
-
174
-
175
-
176
-
177
-
178
-
179
-
180
-
181
-
182
-
183
-
184
-
185
-
186
-
187
-
188
-
189
-
190
-
191
-
192
-
193
-
194
-
195
-
196
-
197
-
198
-
199
-
200
-
201
-
202
-
203
-
204
-
205
-
206
-
207
-
208
-
209
-
210
-
211
-
212
-
213
-
214
-
215
-
216
-
217
-
218
-
219
-
220
-
221
-
222
-
223
-
224
-
225
-
226
-
227
-
228
-
229
-
230
-
231
-
232
-
233
-
234
-
235
-
236
-
237
-
238
-
239
-
240
-
241
-
242
-
243
-
244
-
245
-
246
-
247
-
248
-
249
-
250
-
251
-
252
-
253
-
254
-
255
-
256
-
257
-
258
-
259
-
260
-
261
-
262
-
263
-
264
-
265
-
266
-
267
-
268
-
269
-
270
-
271
-
272
 |
 |

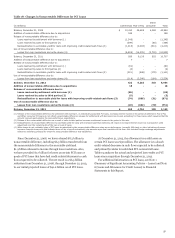
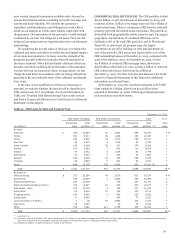
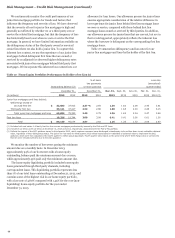
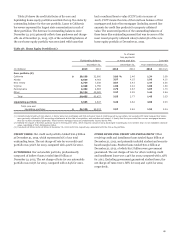
Table 18: Changes in Nonaccretable Difference for PCI Loans
Other
(in millions) Commercial Pick-a-Pay consumer Total
Balance, December 31, 2008 $ 10,410 26,485 4,069 40,964
Addition of nonaccretable difference due to acquisitions 188 - - 188
Release of nonaccretable difference due to:
Loans resolved by settlement with borrower (1) (1,345) - - (1,345)
Loans resolved by sales to third parties (2) (299) - (85) (384)
Reclassification to accretable yield for loans with improving credit-related cash flows (3) (1,216) (2,383) (614) (4,213)
Use of nonaccretable difference due to:
Losses from loan resolutions and write-downs (4) (6,809) (14,976) (2,718) (24,503)
Balance, December 31, 2011 929 9,126 652 10,707
Addition of nonaccretable difference due to acquisitions 7 - - 7
Release of nonaccretable difference due to:
Loans resolved by settlement with borrower (1) (81) - - (81)
Loans resolved by sales to third parties (2) (4) - - (4)
Reclassification to accretable yield for loans with improving credit-related cash flows (3) (315) (648) (178) (1,141)
Use of nonaccretable difference due to:
Losses from loan resolutions and write-downs (4) (114) (2,246) (164) (2,524)
Balance, December 31, 2012 422 6,232 310 6,964
Addition of nonaccretable difference due to acquisitions 18 - - 18
Release of nonaccretable difference due to:
Loans resolved by settlement with borrower (1) (86) - - (86)
Loans resolved by sales to third parties (2) (5) - - (5)
Reclassification to accretable yield for loans with improving credit-related cash flows (3) (74) (866) (31) (971)
Use of nonaccretable difference due to:
Losses from loan resolutions and write-downs (4) (10) (662) (79) (751)
Balance, December 31, 2013 $ 265 4,704 200 5,169
(1) Release of the nonaccretable difference for settlement with borrower, on individually accounted PCI loans, increases interest income in the period of settlement. Pick-a-Pay
and Other consumer PCI loans do not reflect nonaccretable difference releases for settlements with borrowers due to pool accounting for those loans, which assumes that the
amount received approximates the pool performance expectations.
(2) Release of the nonaccretable difference as a result of sales to third parties increases noninterest income in the period of the sale.
(3) Reclassification of nonaccretable difference to accretable yield for loans with increased cash flow estimates will result in increased interest income as a prospective yield
adjustment over the remaining life of the loan or pool of loans.
(4) Write-downs to net realizable value of PCI loans are absorbed by the nonaccretable difference when severe delinquency (normally 180 days) or other indications of severe
borrower financial stress exist that indicate there will be a loss of contractually due amounts upon final resolution of the loan. Also includes foreign exchange adjustments
related to underlying principal for which the nonaccretable difference was established.
Since December 31, 2008, we have released $8.2 billion in
nonaccretable difference, including $6.3 billion transferred from
the nonaccretable difference to the accretable yield and
$1.9 billion released to income through loan resolutions. Also,
we have provided $1.7 billion for losses on certain PCI loans or
pools of PCI loans that have had credit-related decreases to cash
flows expected to be collected. The net result is a $6.5 billion
reduction from December 31, 2008, through December 31, 2013,
in our initial projected losses of $41.0 billion on all PCI loans.
At December 31, 2013, the allowance for credit losses on
certain PCI loans was $30 million. The allowance is to absorb
credit-related decreases in cash flows expected to be collected
and primarily relates to individual PCI commercial loans.
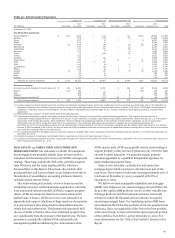
Table 19 analyzes the actual and projected loss results on PCI
loans since acquisition through December 31, 2013.
For additional information on PCI loans, see Note 1
(Summary of Significant Accounting Policies – Loans) and Note
6 (Loans and Allowance for Credit Losses) to Financial
Statements in this Report.
57