Wells Fargo 2013 Annual Report Download - page 68
Download and view the complete annual report
Please find page 68 of the 2013 Wells Fargo annual report below. You can navigate through the pages in the report by either clicking on the pages listed below, or by using the keyword search tool below to find specific information within the annual report.-
 1
1 -
2
-
3
-
4
-
5
-
6
-
7
-
8
-
9
-
10
-
11
-
12
-
13
-
14
-
15
-
16
-
17
-
18
-
19
-
20
-
21
-
22
-
23
-
24
-
25
-
26
-
27
-
28
-
29
-
30
-
31
-
32
-
33
-
34
-
35
-
36
-
37
-
38
-
39
-
40
-
41
-
42
-
43
-
44
-
45
-
46
-
47
-
48
-
49
-
50
-
51
-
52
-
53
-
54
-
55
-
56
-
57
-
 58
58 -
 59
59 -
 60
60 -
 61
61 -
 62
62 -
 63
63 -
 64
64 -
 65
65 -
 66
66 -
 67
67 -
 68
68 -
 69
69 -
 70
70 -
 71
71 -
 72
72 -
 73
73 -
 74
74 -
 75
75 -
 76
76 -
 77
77 -
 78
78 -
79
-
80
-
81
-
82
-
83
-
84
-
85
-
86
-
87
-
88
-
89
-
90
-
91
-
92
-
93
-
94
-
95
-
96
-
97
-
98
-
99
-
100
-
101
-
102
-
103
-
104
-
105
-
106
-
107
-
108
-
109
-
110
-
111
-
112
-
113
-
114
-
115
-
116
-
117
-
118
-
119
-
120
-
121
-
122
-
123
-
124
-
125
-
126
-
127
-
128
-
129
-
130
-
131
-
132
-
133
-
134
-
135
-
136
-
137
-
138
-
139
-
140
-
141
-
142
-
143
-
144
-
145
-
146
-
147
-
148
-
149
-
150
-
151
-
152
-
153
-
154
-
155
-
156
-
157
-
158
-
159
-
160
-
161
-
162
-
163
-
164
-
165
-
166
-
167
-
168
-
169
-
170
-
171
-
172
-
173
-
174
-
175
-
176
-
177
-
178
-
179
-
180
-
181
-
182
-
183
-
184
-
185
-
186
-
187
-
188
-
189
-
190
-
191
-
192
-
193
-
194
-
195
-
196
-
197
-
198
-
199
-
200
-
201
-
202
-
203
-
204
-
205
-
206
-
207
-
208
-
209
-
210
-
211
-
212
-
213
-
214
-
215
-
216
-
217
-
218
-
219
-
220
-
221
-
222
-
223
-
224
-
225
-
226
-
227
-
228
-
229
-
230
-
231
-
232
-
233
-
234
-
235
-
236
-
237
-
238
-
239
-
240
-
241
-
242
-
243
-
244
-
245
-
246
-
247
-
248
-
249
-
250
-
251
-
252
-
253
-
254
-
255
-
256
-
257
-
258
-
259
-
260
-
261
-
262
-
263
-
264
-
265
-
266
-
267
-
268
-
269
-
270
-
271
-
272
 |
 |

Risk Management – Credit Risk Management (continued)
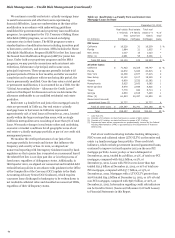
We continuously monitor the credit performance of our allowance for loan losses. Our allowance process for junior liens
junior lien mortgage portfolio for trends and factors that ensures appropriate consideration of the relative difference in
influence the frequency and severity of loss. We have observed loss experience for junior liens behind first lien mortgage loans
that the severity of loss for junior lien mortgages is high and we own or service, compared with those behind first lien
generally not affected by whether we or a third party own or mortgage loans owned or serviced by third parties. In addition,
service the related first mortgage, but that the frequency of loss our allowance process for junior liens that are current, but are in
has historically been lower when we own or service the first their revolving period, appropriately reflects the inherent loss
mortgage. In general, we have limited information available on where the borrower is delinquent on the corresponding first lien
the delinquency status of the third party owned or serviced mortgage loans.
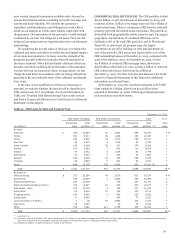
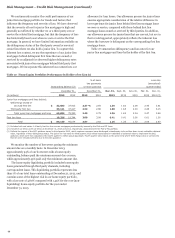
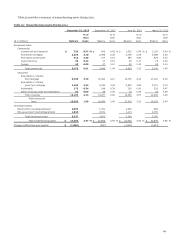
senior lien where we also hold a junior lien. To capture this Table 27 summarizes delinquency and loss rates for our
inherent loss content, we use the experience of our junior lien junior lien mortgages and lines by the holder of the first lien.
mortgages behind delinquent first liens that are owned or
serviced by us adjusted for observed higher delinquency rates
associated with junior lien mortgages behind third party first
mortgages. We incorporate this inherent loss content into our
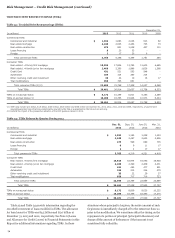
Table 27: Home Equity Portfolios Performance by Holder of 1st Lien (1)
Outstanding balance (2)
% of loans
two payments
or more past due
Loss rate
(annualized)
quarter ended
December 31, December 31,
(in millions) 2013 2012 2013 2012
Dec. 31,
2013
Sept. 30,
2013
June 30,
2013
Mar. 31,
2013
Dec. 31,
2012 (3)
Junior lien mortgages and lines behind:
Wells Fargo owned or
serviced first lien $ 32,683 37,913 2.37 % 2.65 1.35 1.60 2.08 2.46 3.81
Third party first lien 33,121 37,417 2.54 2.86 1.38 1.65 2.00 2.48 3.15
Total junior lien mortgages and lines 65,804 75,330 2.45 2.75 1.36 1.62 2.04 2.47 3.48
First lien lines 18,326 19,744 3.00 3.08 0.41 0.41 0.56 0.61 1.00
Total $ 84,130 95,074 2.57 2.82 1.16 1.36 1.72 2.08 2.97
(3) Reflects the impact of the OCC guidance issued in third quarter 2012, which requires consumer loans discharged in bankruptcy to be written down to net realizable collateral
value, regardless of their delinquency status. The junior lien loss rates for third quarter 2012 reflect losses based on estimates of collateral value to implement the OCC
guidance, which were then adjusted in the fourth quarter to reflect actual appraisals. Fourth quarter 2012 losses on the junior liens where Wells Fargo owns or services the
first lien were elevated primarily due to the OCC guidance.
(2) Includes $1.2 billion and $1.3 billion at December 31, 2013 and 2012, respectively, associated with the Pick-a-Pay portfolio.
(1) Excludes both real estate 1-4 family first lien line reverse mortgages predominantly insured by the FHA and PCI loans.
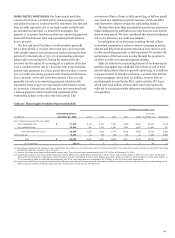
We monitor the number of borrowers paying the minimum
amount due on a monthly basis. In December 2013,
approximately 94% of our borrowers with a home equity
outstanding balance paid the minimum amount due or more,
while approximately 45% paid only the minimum amount due.
The home equity liquidating portfolio includes home equity
loans generated through third party channels, including
correspondent loans. This liquidating portfolio represents less
than 1% of our total loans outstanding at December 31, 2013, and
contains some of the highest risk in our home equity portfolio,
with a loss rate of 4.80% compared with 1.43% for the core (non-
liquidating) home equity portfolio for the year ended
December 31, 2013.
66