Wells Fargo 2013 Annual Report Download - page 69
Download and view the complete annual report
Please find page 69 of the 2013 Wells Fargo annual report below. You can navigate through the pages in the report by either clicking on the pages listed below, or by using the keyword search tool below to find specific information within the annual report.-
 1
1 -
2
-
3
-
4
-
5
-
6
-
7
-
8
-
9
-
10
-
11
-
12
-
13
-
14
-
15
-
16
-
17
-
18
-
19
-
20
-
21
-
22
-
23
-
24
-
25
-
26
-
27
-
28
-
29
-
30
-
31
-
32
-
33
-
34
-
35
-
36
-
37
-
38
-
39
-
40
-
41
-
42
-
43
-
44
-
45
-
46
-
47
-
48
-
49
-
50
-
51
-
52
-
53
-
54
-
55
-
56
-
57
-
58
-
 59
59 -
 60
60 -
 61
61 -
 62
62 -
 63
63 -
 64
64 -
 65
65 -
 66
66 -
 67
67 -
 68
68 -
 69
69 -
 70
70 -
 71
71 -
 72
72 -
 73
73 -
 74
74 -
 75
75 -
 76
76 -
 77
77 -
 78
78 -
 79
79 -
80
-
81
-
82
-
83
-
84
-
85
-
86
-
87
-
88
-
89
-
90
-
91
-
92
-
93
-
94
-
95
-
96
-
97
-
98
-
99
-
100
-
101
-
102
-
103
-
104
-
105
-
106
-
107
-
108
-
109
-
110
-
111
-
112
-
113
-
114
-
115
-
116
-
117
-
118
-
119
-
120
-
121
-
122
-
123
-
124
-
125
-
126
-
127
-
128
-
129
-
130
-
131
-
132
-
133
-
134
-
135
-
136
-
137
-
138
-
139
-
140
-
141
-
142
-
143
-
144
-
145
-
146
-
147
-
148
-
149
-
150
-
151
-
152
-
153
-
154
-
155
-
156
-
157
-
158
-
159
-
160
-
161
-
162
-
163
-
164
-
165
-
166
-
167
-
168
-
169
-
170
-
171
-
172
-
173
-
174
-
175
-
176
-
177
-
178
-
179
-
180
-
181
-
182
-
183
-
184
-
185
-
186
-
187
-
188
-
189
-
190
-
191
-
192
-
193
-
194
-
195
-
196
-
197
-
198
-
199
-
200
-
201
-
202
-
203
-
204
-
205
-
206
-
207
-
208
-
209
-
210
-
211
-
212
-
213
-
214
-
215
-
216
-
217
-
218
-
219
-
220
-
221
-
222
-
223
-
224
-
225
-
226
-
227
-
228
-
229
-
230
-
231
-
232
-
233
-
234
-
235
-
236
-
237
-
238
-
239
-
240
-
241
-
242
-
243
-
244
-
245
-
246
-
247
-
248
-
249
-
250
-
251
-
252
-
253
-
254
-
255
-
256
-
257
-
258
-
259
-
260
-
261
-
262
-
263
-
264
-
265
-
266
-
267
-
268
-
269
-
270
-
271
-
272
 |
 |
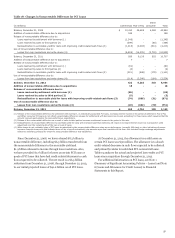
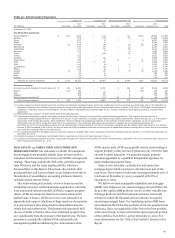
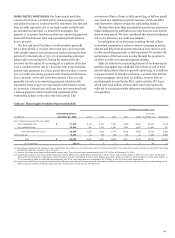
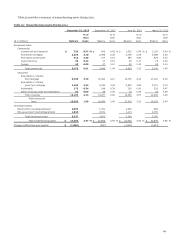
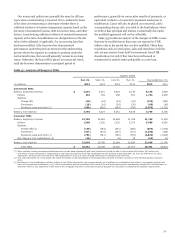
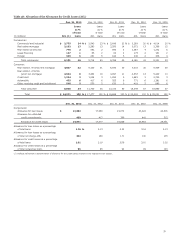
Table 28 shows the credit attributes of the core and
liquidating home equity portfolios and lists the top five states by
outstanding balance for the core portfolio. Loans to California
borrowers represent the largest state concentration in each of
these portfolios. The decrease in outstanding balances since
December 31, 2012 primarily reflects loan paydowns and charge-
offs. As of December 31, 2013, 23% of the outstanding balance of
the core home equity portfolio was associated with loans that
had a combined loan to value (CLTV) ratio in excess of
100%. CLTV means the ratio of the total loan balance of first
mortgages and junior lien mortgages (including unused line
amounts for credit line products) to property collateral
value. The unsecured portion of the outstanding balances of
these loans (the outstanding amount that was in excess of the
most recent property collateral value) totaled 9% of the core
home equity portfolio at December 31, 2013.
Table 28: Home Equity Portfolios (1)
Outstanding balance
December 31,
% of loans
two payments
or more past due
December 31,
Loss rate
Year ended December 31,
(in millions) 2013 2012 2013 2012 2013 2012 (2)
Core portfolio (3)
California $ 20,198 22,900 2.08 % 2.46 1.34 3.59
Florida 8,699 9,763 3.57 4.15 1.99 4.10
New Jersey 6,734 7,338 3.57 3.43 1.47 2.50
Virginia 4,328 4,758 1.96 2.04 1.00 1.83
Pennsylvania 4,282 4,683 2.79 2.67 1.07 1.73
Other 36,194 40,985 2.37 2.59 1.44 2.84
Total 80,435 90,427 2.53 2.77 1.43 3.03
Liquidating portfolio 3,695 4,647 3.49 3.82 4.80 9.03
Total core and
liquidating portfolios $ 84,130 95,074 2.57 2.82 1.59 3.34
(1) Consists predominantly of real estate 1-4 family junior lien mortgages and first and junior lines of credit secured by real estate, but excludes PCI loans because their losses
were generally reflected in PCI accounting adjustments at the date of acquisition, and excludes real estate 1-4 family first lien open-ended line reverse mortgages because
they do not have scheduled payments. These reverse mortgage loans are predominantly insured by the FHA.
(2) Reflects the impact of the OCC guidance issued in third quarter 2012, which requires consumer loans discharged in bankruptcy to be written down to net realizable collateral
value, regardless of their delinquency status.
(3) Includes $1.2 billion and $1.3 billion at December 31, 2013 and 2012, respectively, associated with the Pick-a-Pay portfolio.
CREDIT CARDS Our credit card portfolio totaled $26.9 billion
at December 31, 2013, which represented 3% of our total
outstanding loans. The net charge-off rate for our credit card
portfolio was 3.62% for 2013, compared with 4.02% for 2012.
AUTOMOBILE Our automobile portfolio, predominantly
composed of indirect loans, totaled $50.8 billion at
December 31, 2013. The net charge-off rate for our automobile
portfolio was 0.63% for 2013, compared with 0.64% for 2012.
OTHER REVOLVING CREDIT AND INSTALLMENT Other
revolving credit and installment loans totaled $43.0 billion at
December 31, 2013, and primarily included student and security-
based margin loans. Student loans totaled $22.0 billion at
December 31, 2013, of which $10.7 billion were government
guaranteed. The net charge-off rate for other revolving credit
and installment loans was 1.43% for 2013, compared with 1.38%
for 2012. Excluding government guaranteed student loans, the
net charge-off rates were 1.88% for 2013 and 1.96% for 2012,
respectively.
67