Wells Fargo 2013 Annual Report Download - page 51
Download and view the complete annual report
Please find page 51 of the 2013 Wells Fargo annual report below. You can navigate through the pages in the report by either clicking on the pages listed below, or by using the keyword search tool below to find specific information within the annual report.-
 1
1 -
2
-
3
-
4
-
5
-
6
-
7
-
8
-
9
-
10
-
11
-
12
-
13
-
14
-
15
-
16
-
17
-
18
-
19
-
20
-
21
-
22
-
23
-
24
-
25
-
26
-
27
-
28
-
29
-
30
-
31
-
32
-
33
-
34
-
35
-
36
-
37
-
38
-
39
-
40
-
 41
41 -
 42
42 -
 43
43 -
 44
44 -
 45
45 -
 46
46 -
 47
47 -
 48
48 -
 49
49 -
 50
50 -
 51
51 -
 52
52 -
 53
53 -
 54
54 -
 55
55 -
 56
56 -
 57
57 -
 58
58 -
 59
59 -
 60
60 -
 61
61 -
62
-
63
-
64
-
65
-
66
-
67
-
68
-
69
-
70
-
71
-
72
-
73
-
74
-
75
-
76
-
77
-
78
-
79
-
80
-
81
-
82
-
83
-
84
-
85
-
86
-
87
-
88
-
89
-
90
-
91
-
92
-
93
-
94
-
95
-
96
-
97
-
98
-
99
-
100
-
101
-
102
-
103
-
104
-
105
-
106
-
107
-
108
-
109
-
110
-
111
-
112
-
113
-
114
-
115
-
116
-
117
-
118
-
119
-
120
-
121
-
122
-
123
-
124
-
125
-
126
-
127
-
128
-
129
-
130
-
131
-
132
-
133
-
134
-
135
-
136
-
137
-
138
-
139
-
140
-
141
-
142
-
143
-
144
-
145
-
146
-
147
-
148
-
149
-
150
-
151
-
152
-
153
-
154
-
155
-
156
-
157
-
158
-
159
-
160
-
161
-
162
-
163
-
164
-
165
-
166
-
167
-
168
-
169
-
170
-
171
-
172
-
173
-
174
-
175
-
176
-
177
-
178
-
179
-
180
-
181
-
182
-
183
-
184
-
185
-
186
-
187
-
188
-
189
-
190
-
191
-
192
-
193
-
194
-
195
-
196
-
197
-
198
-
199
-
200
-
201
-
202
-
203
-
204
-
205
-
206
-
207
-
208
-
209
-
210
-
211
-
212
-
213
-
214
-
215
-
216
-
217
-
218
-
219
-
220
-
221
-
222
-
223
-
224
-
225
-
226
-
227
-
228
-
229
-
230
-
231
-
232
-
233
-
234
-
235
-
236
-
237
-
238
-
239
-
240
-
241
-
242
-
243
-
244
-
245
-
246
-
247
-
248
-
249
-
250
-
251
-
252
-
253
-
254
-
255
-
256
-
257
-
258
-
259
-
260
-
261
-
262
-
263
-
264
-
265
-
266
-
267
-
268
-
269
-
270
-
271
-
272
 |
 |

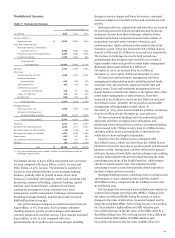
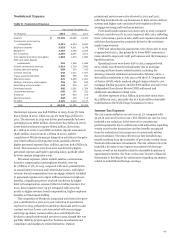
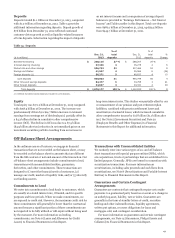
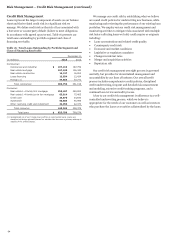
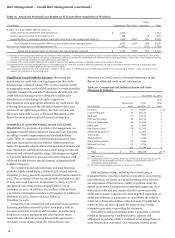
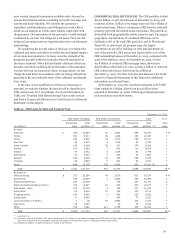
Deposits
Deposits totaled $1.1 trillion at December 31, 2013, compared
with $1.0 trillion at December 31, 2012. Table 14 provides
additional information regarding deposits. Deposit growth of
$76 billion from December 31, 2012 reflected continued
customer-driven growth as well as liquidity-related issuances
of term deposits. Information regarding the impact of deposits
on net interest income and a comparison of average deposit
balances is provided in “Earnings Performance – Net Interest
Income” and Table 5 earlier in this Report. Total core deposits
were $980.1 billion at December 31, 2013, up $34.4 billion
from $945.7 billion at December 31, 2012.
Table 14: Deposits
($ in millions)
Dec. 31,
2013
% of
total
deposits
Dec. 31,
2012
% of
total
deposits
%
Change
Noninterest-bearing $ 288,116 27 % $ 288,207 29 % -
Interest-bearing checking 37,346 3 35,275 4 6
Market rate and other savings 556,763 52 517,464 52 8
Savings certificates 41,567 4 55,966 6 (26)
Foreign deposits (1) 56,271 5 48,837 4 15
Core deposits 980,063 91 945,749 95 4
Other time and savings deposits 64,477 6 33,755 3 91
Other foreign deposits 34,637 3 23,331 2 48
Total deposits $ 1,079,177 100 % $ 1,002,835 100 % 8
(1) Reflects Eurodollar sweep balances included in core deposits.
Equity
Total equity was $171.0 billion at December 31, 2013 compared
with $158.9 billion at December 31, 2012. The increase was
predominantly driven by a $14.7 billion increase in retained
earnings from earnings net of dividends paid, partially offset by
a $4.3 billion decline in cumulative other comprehensive
income (OCI). The decline in OCI was due to a $7.9 billion
($4.9 billion after tax) reduction in net unrealized gains on our
investment securities portfolio resulting from an increase in
long-term interest rates. This decline was partially offset by our
re-measurement of our pension and post-retirement plan
liabilities, combined with pension settlement losses and
amortization of actuarial losses, which increased cumulative
other comprehensive income by $1.8 billion ($1.1 billion after
tax). See Note 5 (Investment Securities) and Note 20
(Employee Benefits and Other Expenses) to Financial
Statements in this Report for additional information.
Off-Balance Sheet Arrangements
In the ordinary course of business, we engage in financial
transactions that are not recorded on the balance sheet, or may
be recorded on the balance sheet in amounts that are different
from the full contract or notional amount of the transaction. Our
off-balance sheet arrangements include commitments to lend,
transactions with unconsolidated entities, guarantees,
derivatives, and other commitments. These transactions are
designed to (1) meet the financial needs of customers, (2)
manage our credit, market or liquidity risks, and/or (3) diversify
our funding sources.
Commitments to Lend
We enter into commitments to lend funds to customers, which
are usually at a stated interest rate, if funded, and for specific
purposes and time periods. When we make commitments, we
are exposed to credit risk. However, the maximum credit risk for
these commitments will generally be lower than the contractual
amount because a significant portion of these commitments are
not expected to be fully utilized or will expire without being used
by the customer. For more information on lending
commitments, see Note 6 (Loans and Allowance for Credit
Losses) to Financial Statements in this Report.
Transactions with Unconsolidated Entities
We routinely enter into various types of on- and off-balance
sheet transactions with special purpose entities (SPEs), which
are corporations, trusts or partnerships that are established for a
limited purpose. Generally, SPEs are formed in connection with
securitization transactions. For more information on
securitizations, including sales proceeds and cash flows from
securitizations, see Note 8 (Securitizations and Variable Interest
Entities) to Financial Statements in this Report.
Guarantees and Certain Contingent
Arrangements
Guarantees are contracts that contingently require us to make
payments to a guaranteed party based on an event or a change in
an underlying asset, liability, rate or index. Guarantees are
generally in the form of standby letters of credit, securities
lending and other indemnifications, liquidity agreements,
written put options, recourse obligations for loans and
mortgages sold, and contingent consideration.
For more information on guarantees and certain contingent
arrangements, see Note 14 (Guarantees, Pledged Assets and
Collateral) to Financial Statements in this Report.
49