Wells Fargo 2013 Annual Report Download - page 221
Download and view the complete annual report
Please find page 221 of the 2013 Wells Fargo annual report below. You can navigate through the pages in the report by either clicking on the pages listed below, or by using the keyword search tool below to find specific information within the annual report.-
 1
1 -
2
-
3
-
4
-
5
-
6
-
7
-
8
-
9
-
10
-
11
-
12
-
13
-
14
-
15
-
16
-
17
-
18
-
19
-
20
-
21
-
22
-
23
-
24
-
25
-
26
-
27
-
28
-
29
-
30
-
31
-
32
-
33
-
34
-
35
-
36
-
37
-
38
-
39
-
40
-
41
-
42
-
43
-
44
-
45
-
46
-
47
-
48
-
49
-
50
-
51
-
52
-
53
-
54
-
55
-
56
-
57
-
58
-
59
-
60
-
61
-
62
-
63
-
64
-
65
-
66
-
67
-
68
-
69
-
70
-
71
-
72
-
73
-
74
-
75
-
76
-
77
-
78
-
79
-
80
-
81
-
82
-
83
-
84
-
85
-
86
-
87
-
88
-
89
-
90
-
91
-
92
-
93
-
94
-
95
-
96
-
97
-
98
-
99
-
100
-
101
-
102
-
103
-
104
-
105
-
106
-
107
-
108
-
109
-
110
-
111
-
112
-
113
-
114
-
115
-
116
-
117
-
118
-
119
-
120
-
121
-
122
-
123
-
124
-
125
-
126
-
127
-
128
-
129
-
130
-
131
-
132
-
133
-
134
-
135
-
136
-
137
-
138
-
139
-
140
-
141
-
142
-
143
-
144
-
145
-
146
-
147
-
148
-
149
-
150
-
151
-
152
-
153
-
154
-
155
-
156
-
157
-
158
-
159
-
160
-
161
-
162
-
163
-
164
-
165
-
166
-
167
-
168
-
169
-
170
-
171
-
172
-
173
-
174
-
175
-
176
-
177
-
178
-
179
-
180
-
181
-
182
-
183
-
184
-
185
-
186
-
187
-
188
-
189
-
190
-
191
-
192
-
193
-
194
-
195
-
196
-
197
-
198
-
199
-
200
-
201
-
202
-
203
-
204
-
205
-
206
-
207
-
208
-
209
-
210
-
 211
211 -
 212
212 -
 213
213 -
 214
214 -
 215
215 -
 216
216 -
 217
217 -
 218
218 -
 219
219 -
 220
220 -
 221
221 -
 222
222 -
 223
223 -
 224
224 -
 225
225 -
 226
226 -
 227
227 -
 228
228 -
 229
229 -
 230
230 -
 231
231 -
232
-
233
-
234
-
235
-
236
-
237
-
238
-
239
-
240
-
241
-
242
-
243
-
244
-
245
-
246
-
247
-
248
-
249
-
250
-
251
-
252
-
253
-
254
-
255
-
256
-
257
-
258
-
259
-
260
-
261
-
262
-
263
-
264
-
265
-
266
-
267
-
268
-
269
-
270
-
271
-
272
 |
 |

-
- - - -
- - - -
- - -
- -
-
- - - - -
-
- - -
- - - -
-
-
- - -
-
- - - -
- - - - -
-
-
-
-
-
- - -
-
- - - -
- - - -
- - - -
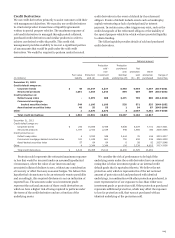
$
$
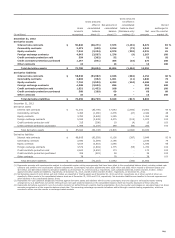
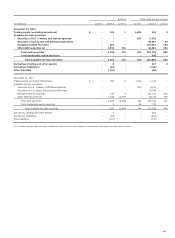
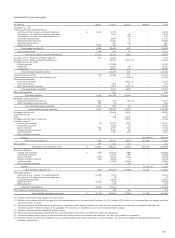
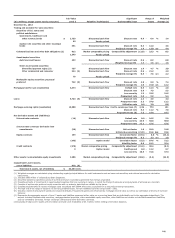
Brokers Third party pricing services
(in millions) Level 1 Level 2 Level 3 Level 1 Level 2 Level 3
December 31, 2013
Trading assets (excluding derivatives) 122 1 1,804 652 3
Available-for-sale securities:
Securities of U.S. Treasury and federal agencies 557 5,723
Securities of U.S. states and political subdivisions 39,257 63
Mortgage-backed securities 621 148,074 180
Other debt securities (1) 1,537 722 44,681 746
Total debt securities 2,158 722 557 237,735 989
Total marketable equity securities 630
Total available-for-sale securities 2,158 722 557 238,365 989
Derivatives (trading and other assets)5 417 3
Derivatives (liabilities) (12) (418)
Other liabilities (115) (36)
December 31, 2012
Trading assets (excluding derivatives) 406 8 1,314 1,016
Available-for-sale securities:
Securities of U.S. Treasury and federal agencies 915 6,231
Securities of U.S. states and political subdivisions 35,036
Mortgage-backed securities 138 4 121,703 292
Other debt securities (1) 1,516 12,465 28,314 149
Total debt securities 1,654 12,469 915 191,284 441
Total marketable equity securities 3 29 774
Total available-for-sale securities 1,657 12,469 944 192,058 441
Derivatives (trading and other assets) 8 602
Derivatives (liabilities) (26) (634)
Other liabilities (121) (104)
(1) Includes corporate debt securities, collateralized loan and other debt obligations, asset-backed securities, and other debt securities.
219