Wells Fargo 2013 Annual Report Download - page 244
Download and view the complete annual report
Please find page 244 of the 2013 Wells Fargo annual report below. You can navigate through the pages in the report by either clicking on the pages listed below, or by using the keyword search tool below to find specific information within the annual report.-
 1
1 -
2
-
3
-
4
-
5
-
6
-
7
-
8
-
9
-
10
-
11
-
12
-
13
-
14
-
15
-
16
-
17
-
18
-
19
-
20
-
21
-
22
-
23
-
24
-
25
-
26
-
27
-
28
-
29
-
30
-
31
-
32
-
33
-
34
-
35
-
36
-
37
-
38
-
39
-
40
-
41
-
42
-
43
-
44
-
45
-
46
-
47
-
48
-
49
-
50
-
51
-
52
-
53
-
54
-
55
-
56
-
57
-
58
-
59
-
60
-
61
-
62
-
63
-
64
-
65
-
66
-
67
-
68
-
69
-
70
-
71
-
72
-
73
-
74
-
75
-
76
-
77
-
78
-
79
-
80
-
81
-
82
-
83
-
84
-
85
-
86
-
87
-
88
-
89
-
90
-
91
-
92
-
93
-
94
-
95
-
96
-
97
-
98
-
99
-
100
-
101
-
102
-
103
-
104
-
105
-
106
-
107
-
108
-
109
-
110
-
111
-
112
-
113
-
114
-
115
-
116
-
117
-
118
-
119
-
120
-
121
-
122
-
123
-
124
-
125
-
126
-
127
-
128
-
129
-
130
-
131
-
132
-
133
-
134
-
135
-
136
-
137
-
138
-
139
-
140
-
141
-
142
-
143
-
144
-
145
-
146
-
147
-
148
-
149
-
150
-
151
-
152
-
153
-
154
-
155
-
156
-
157
-
158
-
159
-
160
-
161
-
162
-
163
-
164
-
165
-
166
-
167
-
168
-
169
-
170
-
171
-
172
-
173
-
174
-
175
-
176
-
177
-
178
-
179
-
180
-
181
-
182
-
183
-
184
-
185
-
186
-
187
-
188
-
189
-
190
-
191
-
192
-
193
-
194
-
195
-
196
-
197
-
198
-
199
-
200
-
201
-
202
-
203
-
204
-
205
-
206
-
207
-
208
-
209
-
210
-
211
-
212
-
213
-
214
-
215
-
216
-
217
-
218
-
219
-
220
-
221
-
222
-
223
-
224
-
225
-
226
-
227
-
228
-
229
-
230
-
231
-
232
-
233
-
 234
234 -
 235
235 -
 236
236 -
 237
237 -
 238
238 -
 239
239 -
 240
240 -
 241
241 -
 242
242 -
 243
243 -
 244
244 -
 245
245 -
 246
246 -
 247
247 -
 248
248 -
 249
249 -
 250
250 -
 251
251 -
 252
252 -
 253
253 -
 254
254 -
255
-
256
-
257
-
258
-
259
-
260
-
261
-
262
-
263
-
264
-
265
-
266
-
267
-
268
-
269
-
270
-
271
-
272
 |
 |

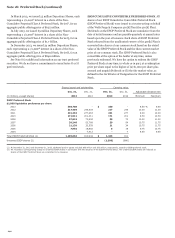
Note 19: Common Stock and Stock Plans (continued)
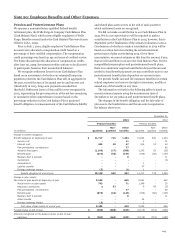
For various acquisitions and mergers, we converted employee
and director stock options of acquired or merged companies into
stock options to purchase our common stock based on the terms
of the original stock option plan and the agreed-upon exchange
ratio. In addition, we converted restricted stock awards into
awards that entitle holders to our stock after the vesting
conditions are met. Holders receive cash dividends on
outstanding awards if provided in the original award.
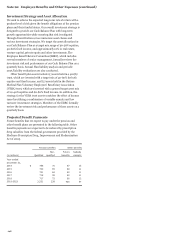
The total number of shares of common stock available for
grant under the plans at December 31, 2013, was 282 million.
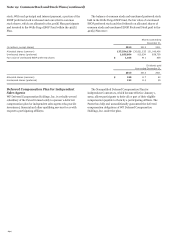
Director Awards
Beginning in 2011, we granted only common stock awards under
the LTICP to non-employee directors elected or re-elected at the
annual meeting of stockholders and prorated awards to directors
who join the Board at any other time. Stock awards vest
immediately. Options also were granted to directors prior to
2011, and can be exercised after twelve months through the tenth
anniversary of the grant date. Options granted prior to 2005 may
include the right to acquire a “reload” stock option.
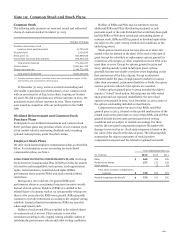
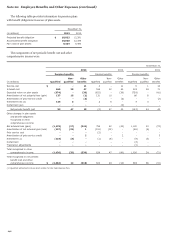
Restricted Share Rights
A summary of the status of our RSRs and restricted share awards
at December 31, 2013, and changes during 2013 is in the
following table:
Number
Weighted-
average
grant-date
fair value
Nonvested at January 1, 2013 55,287,337 $ 29.78
Granted 18,476,399 35.52
Vested (12,233,361) 29.32
Canceled or forfeited (886,381) 30.70
Nonvested at December 31, 2013 60,643,994 31.61
The weighted-average grant date fair value of RSRs granted
during 2012 and 2011 was $31.49 and $31.02, respectively.
At December 31, 2013, there was $702 million of total
unrecognized compensation cost related to nonvested RSRs. The
cost is expected to be recognized over a weighted-average period
of 2.5 years. The total fair value of RSRs that vested during 2013,
2012 and 2011 was $472 million, $89 million and $41 million,
respectively.
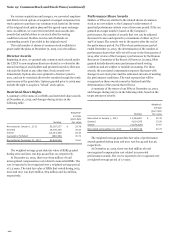
Performance Share Awards
Holders of PSAs are entitled to the related shares of common
stock at no cost subject to the Company's achievement of
specified performance criteria over a three-year period. PSAs are
granted at a target number; based on the Company's
performance, the number of awards that vest can be adjusted
downward to zero and upward to a maximum of either 125% or
150% of target. The awards vest in the quarter after the end of
the performance period. For PSAs whose performance period
ended December 31, 2013, the determination of the number of
performance shares that will vest will occur in the first quarter of
2014, after review of the Company’s performance by the Human
Resources Committee of the Board of Directors. In 2013, PSAs
granted include discretionary performance based vesting
conditions and are subject to variable accounting. For these
awards, the associated compensation expense fluctuates with
changes in our stock price and the estimated outcome of meeting
the performance conditions. The total expense that will be
recognized on these awards cannot be finalized until the
determination of the awards that will vest.
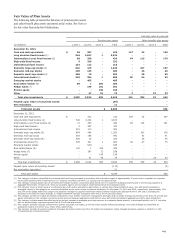
A summary of the status of our PSAs at December 31, 2013
and changes during 2013 is in the following table, based on the
target amount of awards:
Number
Weighted-
average
grant date
fair value
Nonvested at January 1, 2013 10,294,881 $ 30.35
Granted 4,614,295 33.56
Vested (4,070,028) 27.67
Nonvested at December 31, 2013 10,839,148 32.72
The weighted-average grant date fair value of performance
awards granted during 2012 and 2011 was $31.44 and $31.26,
respectively.
At December 31, 2013, there was $56 million of total
unrecognized compensation cost related to nonvested
performance awards. The cost is expected to be recognized over
a weighted-average period of 1.7 years.
242