Wells Fargo 2013 Annual Report Download - page 137
Download and view the complete annual report
Please find page 137 of the 2013 Wells Fargo annual report below. You can navigate through the pages in the report by either clicking on the pages listed below, or by using the keyword search tool below to find specific information within the annual report.-
 1
1 -
2
-
3
-
4
-
5
-
6
-
7
-
8
-
9
-
10
-
11
-
12
-
13
-
14
-
15
-
16
-
17
-
18
-
19
-
20
-
21
-
22
-
23
-
24
-
25
-
26
-
27
-
28
-
29
-
30
-
31
-
32
-
33
-
34
-
35
-
36
-
37
-
38
-
39
-
40
-
41
-
42
-
43
-
44
-
45
-
46
-
47
-
48
-
49
-
50
-
51
-
52
-
53
-
54
-
55
-
56
-
57
-
58
-
59
-
60
-
61
-
62
-
63
-
64
-
65
-
66
-
67
-
68
-
69
-
70
-
71
-
72
-
73
-
74
-
75
-
76
-
77
-
78
-
79
-
80
-
81
-
82
-
83
-
84
-
85
-
86
-
87
-
88
-
89
-
90
-
91
-
92
-
93
-
94
-
95
-
96
-
97
-
98
-
99
-
100
-
101
-
102
-
103
-
104
-
105
-
106
-
107
-
108
-
109
-
110
-
111
-
112
-
113
-
114
-
115
-
116
-
117
-
118
-
119
-
120
-
121
-
122
-
123
-
124
-
125
-
126
-
 127
127 -
 128
128 -
 129
129 -
 130
130 -
 131
131 -
 132
132 -
 133
133 -
 134
134 -
 135
135 -
 136
136 -
 137
137 -
 138
138 -
 139
139 -
 140
140 -
 141
141 -
 142
142 -
 143
143 -
 144
144 -
 145
145 -
 146
146 -
 147
147 -
148
-
149
-
150
-
151
-
152
-
153
-
154
-
155
-
156
-
157
-
158
-
159
-
160
-
161
-
162
-
163
-
164
-
165
-
166
-
167
-
168
-
169
-
170
-
171
-
172
-
173
-
174
-
175
-
176
-
177
-
178
-
179
-
180
-
181
-
182
-
183
-
184
-
185
-
186
-
187
-
188
-
189
-
190
-
191
-
192
-
193
-
194
-
195
-
196
-
197
-
198
-
199
-
200
-
201
-
202
-
203
-
204
-
205
-
206
-
207
-
208
-
209
-
210
-
211
-
212
-
213
-
214
-
215
-
216
-
217
-
218
-
219
-
220
-
221
-
222
-
223
-
224
-
225
-
226
-
227
-
228
-
229
-
230
-
231
-
232
-
233
-
234
-
235
-
236
-
237
-
238
-
239
-
240
-
241
-
242
-
243
-
244
-
245
-
246
-
247
-
248
-
249
-
250
-
251
-
252
-
253
-
254
-
255
-
256
-
257
-
258
-
259
-
260
-
261
-
262
-
263
-
264
-
265
-
266
-
267
-
268
-
269
-
270
-
271
-
272
 |
 |
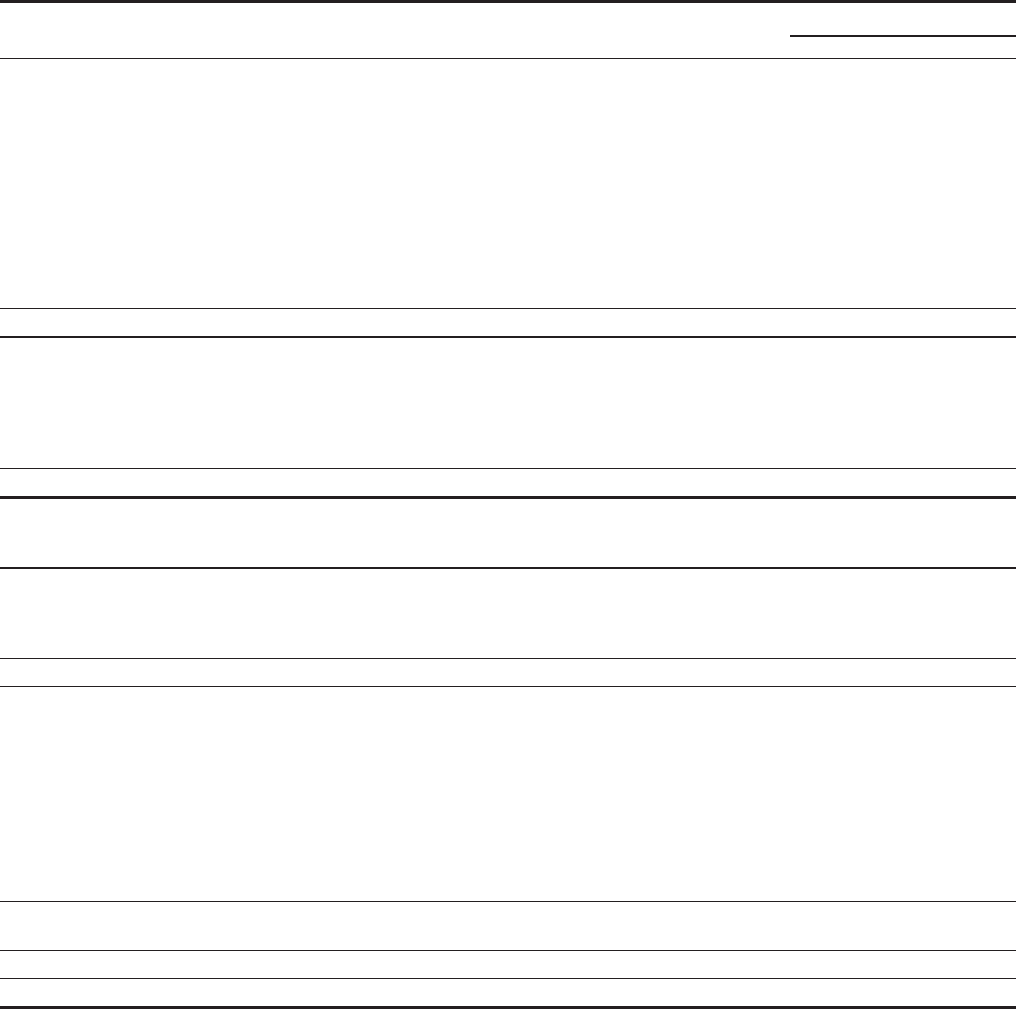
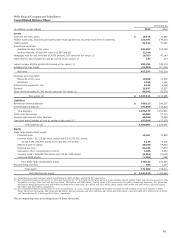
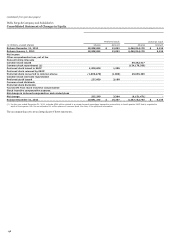
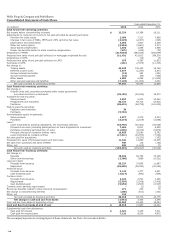
Wells Fargo & Company and Subsidiaries
Consolidated Balance Sheet
December 31,
(in millions, except shares) 2013 2012
Assets
Cash and due from banks $ 19,919 21,860
Federal funds sold, securities purchased under resale agreements and other short-term investments 213,793 137,313
Trading assets 62,813 57,482
Investment securities:
Available-for-sale, at fair value 252,007 235,199
Held-to-maturity, at cost (fair value $12,247 and $0) 12,346 -
Mortgages held for sale (includes $13,879 and $42,305 carried at fair value) (1) 16,763 47,149
Loans held for sale (includes $1 and $6 carried at fair value) (1) 133 110
Loans (includes $5,995 and $6,206 carried at fair value) (1) 825,799 799,574
Allowance for loan losses (14,502) (17,060)
Net loans 811,297 782,514
Mortgage servicing rights:
Measured at fair value 15,580 11,538
Amortized 1,229 1,160
Premises and equipment, net 9,156 9,428
Goodwill 25,637 25,637
Other assets (includes $1,386 and $0 carried at fair value) (1) 86,342 93,578
Total assets (2) $ 1,527,015 1,422,968
Liabilities
Noninterest-bearing deposits $ 288,117 288,207
Interest-bearing deposits 791,060 714,628
Total deposits 1,079,177 1,002,835
Short-term borrowings 53,883 57,175
Accrued expenses and other liabilities 69,949 76,668
Long-term debt (includes $0 and $1 carried at fair value) (1) 152,998 127,379
Total liabilities (3) 1,356,007 1,264,057
Equity
Wells Fargo stockholders' equity:
Preferred stock 16,267 12,883
Common stock – $1-2/3 par value, authorized 9,000,000,000 shares;
issued 5,481,811,474 shares and 5,481,811,474 shares 9,136 9,136
Additional paid-in capital 60,296 59,802
Retained earnings 92,361 77,679
Cumulative other comprehensive income 1,386 5,650
Treasury stock – 224,648,769 shares and 215,497,298 shares (8,104) (6,610)
Unearned ESOP shares (1,200) (986)
Total Wells Fargo stockholders' equity 170,142 157,554
Noncontrolling interests 866 1,357
Total equity 171,008 158,911
Total liabilities and equity $ 1,527,015 1,422,968
(1) Parenthetical amounts represent assets and liabilities for which we have elected the fair value option.
(2) Our consolidated assets at December 31, 2013 and December 31, 2012, include the following assets of certain variable interest entities (VIEs) that can only be used to settle
the liabilities of those VIEs: Cash and due from banks, $165 million and $260 million; Trading assets, $162 million and $114 million; Investment Securities, $1.4 billion and
$2.8 billion; Mortgages held for sale, $38 million and $469 million; Net loans, $6.0 billion and $10.6 billion; Other assets, $347 million and $457 million, and Total assets,
$8.1 billion and $14.6 billion, respectively.
(3) Our consolidated liabilities at December 31, 2013 and December 31, 2012, include the following VIE liabilities for which the VIE creditors do not have recourse to Wells
Fargo: Short-term borrowings, $29 million and $0 million; Accrued expenses and other liabilities, $90 million and $134 million; Long-term debt, $2.3 billion and $3.5 billion;
and Total liabilities, $2.4 billion and $3.6 billion, respectively.
The accompanying notes are an integral part of these statements.
135