Wells Fargo 2013 Annual Report Download - page 171
Download and view the complete annual report
Please find page 171 of the 2013 Wells Fargo annual report below. You can navigate through the pages in the report by either clicking on the pages listed below, or by using the keyword search tool below to find specific information within the annual report.-
 1
1 -
2
-
3
-
4
-
5
-
6
-
7
-
8
-
9
-
10
-
11
-
12
-
13
-
14
-
15
-
16
-
17
-
18
-
19
-
20
-
21
-
22
-
23
-
24
-
25
-
26
-
27
-
28
-
29
-
30
-
31
-
32
-
33
-
34
-
35
-
36
-
37
-
38
-
39
-
40
-
41
-
42
-
43
-
44
-
45
-
46
-
47
-
48
-
49
-
50
-
51
-
52
-
53
-
54
-
55
-
56
-
57
-
58
-
59
-
60
-
61
-
62
-
63
-
64
-
65
-
66
-
67
-
68
-
69
-
70
-
71
-
72
-
73
-
74
-
75
-
76
-
77
-
78
-
79
-
80
-
81
-
82
-
83
-
84
-
85
-
86
-
87
-
88
-
89
-
90
-
91
-
92
-
93
-
94
-
95
-
96
-
97
-
98
-
99
-
100
-
101
-
102
-
103
-
104
-
105
-
106
-
107
-
108
-
109
-
110
-
111
-
112
-
113
-
114
-
115
-
116
-
117
-
118
-
119
-
120
-
121
-
122
-
123
-
124
-
125
-
126
-
127
-
128
-
129
-
130
-
131
-
132
-
133
-
134
-
135
-
136
-
137
-
138
-
139
-
140
-
141
-
142
-
143
-
144
-
145
-
146
-
147
-
148
-
149
-
150
-
151
-
152
-
153
-
154
-
155
-
156
-
157
-
158
-
159
-
160
-
 161
161 -
 162
162 -
 163
163 -
 164
164 -
 165
165 -
 166
166 -
 167
167 -
 168
168 -
 169
169 -
 170
170 -
 171
171 -
 172
172 -
 173
173 -
 174
174 -
 175
175 -
 176
176 -
 177
177 -
 178
178 -
 179
179 -
 180
180 -
 181
181 -
182
-
183
-
184
-
185
-
186
-
187
-
188
-
189
-
190
-
191
-
192
-
193
-
194
-
195
-
196
-
197
-
198
-
199
-
200
-
201
-
202
-
203
-
204
-
205
-
206
-
207
-
208
-
209
-
210
-
211
-
212
-
213
-
214
-
215
-
216
-
217
-
218
-
219
-
220
-
221
-
222
-
223
-
224
-
225
-
226
-
227
-
228
-
229
-
230
-
231
-
232
-
233
-
234
-
235
-
236
-
237
-
238
-
239
-
240
-
241
-
242
-
243
-
244
-
245
-
246
-
247
-
248
-
249
-
250
-
251
-
252
-
253
-
254
-
255
-
256
-
257
-
258
-
259
-
260
-
261
-
262
-
263
-
264
-
265
-
266
-
267
-
268
-
269
-
270
-
271
-
272
 |
 |

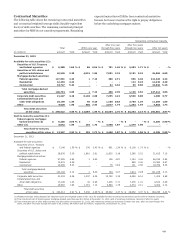
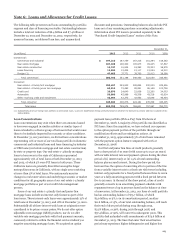
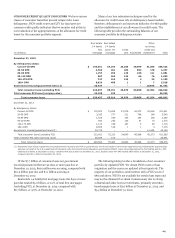
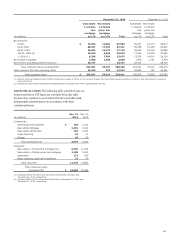
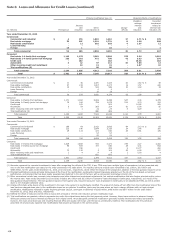
CONSUMER CREDIT QUALITY INDICATORS We have various
classes of consumer loans that present unique risks. Loan
delinquency, FICO credit scores and LTV for loan types are
common credit quality indicators that we monitor and utilize in
our evaluation of the appropriateness of the allowance for credit
losses for the consumer portfolio segment.
Many of our loss estimation techniques used for the
allowance for credit losses rely on delinquency-based models;
therefore, delinquency is an important indicator of credit quality
and the establishment of our allowance for credit losses. The
following table provides the outstanding balances of our
consumer portfolio by delinquency status.
(in millions)
Real estate
1-4 family
first
mortgage
Real estate
1-4 family
junior lien
mortgage
Credit
card Automobile
Other
revolving
credit and
installment Total
December 31, 2013
By delinquency status:
Current-29 DPD $ 193,361 64,194 26,203 49,699 31,866 365,323
30-59 DPD 2,784 461 202 852 178 4,477
60-89 DPD 1,157 253 144 186 111 1,851
90-119 DPD 587 182 124 66 76 1,035
120-179 DPD 747 216 196 4 20 1,183
180+ DPD 5,024 485 1 1 7 5,518
Government insured/guaranteed loans (1) 30,737 - - - 10,696 41,433
Total consumer loans (excluding PCI) 234,397 65,791 26,870 50,808 42,954 420,820
Total consumer PCI loans (carrying value) 24,100 123 - - - 24,223
Total consumer loans $ 258,497 65,914 26,870 50,808 42,954 445,043
December 31, 2012
By delinquency status:
Current-29 DPD $ 179,870 73,256 23,976 44,973 29,546 351,621
30-59 DPD 3,295 577 211 798 168 5,049
60-89 DPD 1,528 339 143 164 108 2,282
90-119 DPD 853 265 122 57 73 1,370
120-179 DPD 1,141 358 187 5 28 1,719
180+ DPD 6,655 518 1 1 4 7,179
Government insured/guaranteed loans (1) 29,719 - - - 12,446 42,165
Total consumer loans (excluding PCI) 223,061 75,313 24,640 45,998 42,373 411,385
Total consumer PCI loans (carrying value) 26,839 152 - - - 26,991
Total consumer loans $ 249,900 75,465 24,640 45,998 42,373 438,376
(1) Represents loans whose repayments are predominantly insured by the FHA or guaranteed by the VA and student loans whose repayments are predominantly guaranteed by
agencies on behalf of the U.S. Department of Education under the Federal Family Education Loan Program (FFELP). Loans insured/guaranteed by the FHA/VA and 90+ DPD
totaled $20.8 billion at December 31 2013, compared with $20.2 billion at December 31, 2012. Student loans 90+ DPD totaled $900 million at December 31, 2013,
compared with $1.1 billion at December 31, 2012.
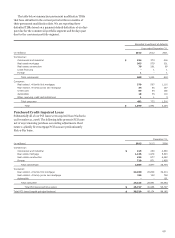
Of the $7.7 billion of consumer loans not government
insured/guaranteed that are 90 days or more past due at
December 31, 2013, $902 million was accruing, compared with
$10.3 billion past due and $1.1 billion accruing at
December 31, 2012.
Real estate 1-4 family first mortgage loans 180 days or more
past due totaled $5.0 billion, or 2.1% of total first mortgages
(excluding PCI), at December 31, 2013, compared with
$6.7 billion, or 3.0%, at December 31, 2012.
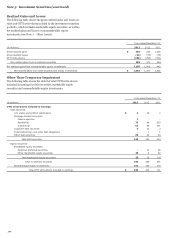
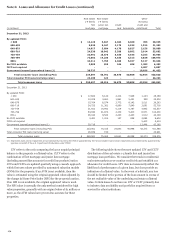
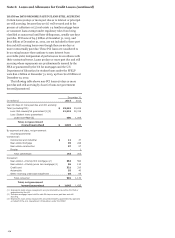
The following table provides a breakdown of our consumer
portfolio by updated FICO. We obtain FICO scores at loan
origination and the scores are updated at least quarterly. The
majority of our portfolio is underwritten with a FICO score of
680 and above. FICO is not available for certain loan types and
may not be obtained if we deem it unnecessary due to strong
collateral and other borrower attributes, primarily securities-
based margin loans of $5.0 billion at December 31, 2013, and
$5.4 billion at December 31, 2012.
169