Wells Fargo 2012 Annual Report Download - page 88
Download and view the complete annual report
Please find page 88 of the 2012 Wells Fargo annual report below. You can navigate through the pages in the report by either clicking on the pages listed below, or by using the keyword search tool below to find specific information within the annual report.-
 1
1 -
2
-
3
-
4
-
5
-
6
-
7
-
8
-
9
-
10
-
11
-
12
-
13
-
14
-
15
-
16
-
17
-
18
-
19
-
20
-
21
-
22
-
23
-
24
-
25
-
26
-
27
-
28
-
29
-
30
-
31
-
32
-
33
-
34
-
35
-
36
-
37
-
38
-
39
-
40
-
41
-
42
-
43
-
44
-
45
-
46
-
47
-
48
-
49
-
50
-
51
-
52
-
53
-
54
-
55
-
56
-
57
-
58
-
59
-
60
-
61
-
62
-
63
-
64
-
65
-
66
-
67
-
68
-
69
-
70
-
71
-
72
-
73
-
74
-
75
-
76
-
77
-
 78
78 -
 79
79 -
 80
80 -
 81
81 -
 82
82 -
 83
83 -
 84
84 -
 85
85 -
 86
86 -
 87
87 -
 88
88 -
 89
89 -
 90
90 -
 91
91 -
 92
92 -
 93
93 -
 94
94 -
 95
95 -
 96
96 -
 97
97 -
 98
98 -
99
-
100
-
101
-
102
-
103
-
104
-
105
-
106
-
107
-
108
-
109
-
110
-
111
-
112
-
113
-
114
-
115
-
116
-
117
-
118
-
119
-
120
-
121
-
122
-
123
-
124
-
125
-
126
-
127
-
128
-
129
-
130
-
131
-
132
-
133
-
134
-
135
-
136
-
137
-
138
-
139
-
140
-
141
-
142
-
143
-
144
-
145
-
146
-
147
-
148
-
149
-
150
-
151
-
152
-
153
-
154
-
155
-
156
-
157
-
158
-
159
-
160
-
161
-
162
-
163
-
164
-
165
-
166
-
167
-
168
-
169
-
170
-
171
-
172
-
173
-
174
-
175
-
176
-
177
-
178
-
179
-
180
-
181
-
182
-
183
-
184
-
185
-
186
-
187
-
188
-
189
-
190
-
191
-
192
-
193
-
194
-
195
-
196
-
197
-
198
-
199
-
200
-
201
-
202
-
203
-
204
-
205
-
206
-
207
-
208
-
209
-
210
-
211
-
212
-
213
-
214
-
215
-
216
-
217
-
218
-
219
-
220
-
221
-
222
-
223
-
224
-
225
-
226
-
227
-
228
-
229
-
230
-
231
-
232
-
233
-
234
-
235
-
236
-
237
-
238
-
239
-
240
-
241
-
242
-
243
-
244
-
245
-
246
-
247
-
248
-
249
-
250
-
251
-
252
 |
 |

Risk Management – Asset/Liability Management (continued)
Stress Testing While VaR captures the risk of loss due to adverse
changes in markets using recent historical data, stress testing
captures the Company’s exposure to extreme events. Stress
testing measures the impacts from extreme, but low probability
market movements. Stress scenarios estimate the risk of losses
based on management’s assumptions of abnormal but severe
market movements such as severe credit spread widening or a
large decline in equity prices. These scenarios also assume that
the market moves happen instantaneously and no repositioning
or hedging activity takes place to mitigate losses as events
unfold. The stress scenarios are updated with recent market
trends and are reviewed on a daily basis by senior management.
The stress scenarios are used for desk level monitoring as well as
overall company-wide estimates.
Sensitivities Sensitivity analysis is the estimated risk of loss for a
single measure such as a 1 basis point increase in rates or a 1
percent decrease in equity prices. We conduct and monitor
sensitivity on interest rates, credit spreads, volatility, equity,
commodity, and foreign exchange. Because VaR is based upon
previous moves in market risk factors over recent periods, it may
not provide accurate predictions of future market moves.
Sensitivity analysis complements VaR as it provides an
indication of risk relative to each factor irrespective of historical
market moves. Sensitivities are monitored at both the desk level
and at an aggregated level by senior management on a daily
basis. Our corporate market risk management function
aggregates all Company exposures to monitor the risk
sensitivities are within established tolerances. Changes to the
Company’s sensitivities are analyzed and reported on a daily
basis. The Company monitors risk exposure from a variety of
perspectives, which include line of business, product, risk type
and legal entity.
MARKET RISK – EQUITY INVESTMENTS We are directly and
indirectly affected by changes in the equity markets. We make
and manage direct equity investments in start-up businesses,
emerging growth companies, management buy-outs,
acquisitions and corporate recapitalizations. We also invest in
non-affiliated funds that make similar private equity
investments. These private equity investments are made within
capital allocations approved by management and the Board. The
Board’s policy is to review business developments, key risks and
historical returns for the private equity investment portfolio at
least annually. Management reviews the valuations of these
investments at least quarterly and assesses them for possible
OTTI. For nonmarketable investments, the analysis is based on
facts and circumstances of each individual investment and the
expectations for that investment’s cash flows and capital needs,
the viability of its business model and our exit strategy.
Nonmarketable investments include private equity investments
accounted for under the cost method and equity method. Private
equity investments are subject to OTTI.
As part of our business to support our customers, we trade
public equities, listed/OTC equity derivatives and convertible
bonds. We have parameters that govern these activities. We also
have marketable equity securities in the securities available-for-
sale portfolio, including securities relating to our venture capital
activities. We manage these investments within capital risk
limits approved by management and the Board and monitored
by Corporate ALCO. Gains and losses on these securities are
recognized in net income when realized and periodically include
OTTI charges.
Changes in equity market prices may also indirectly affect our
net income by (1) the value of third party assets under
management and, hence, fee income, (2) particular borrowers,
whose ability to repay principal and/or interest may be affected
by the stock market, or (3) brokerage activity, related
commission income and other business activities. Each business
line monitors and manages these indirect risks.
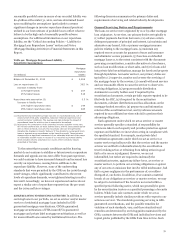
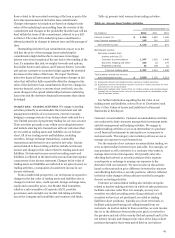
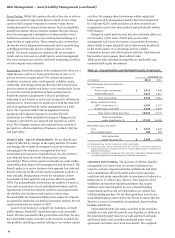
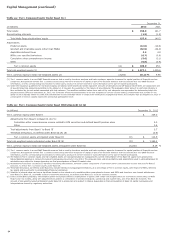
Table 46 provides information regarding our marketable and
nonmarketable equity investments.
Table 46: Nonmarketable and Marketable Equity Investments
December 31,
(in millions) 2012 2011
Nonmarketable equity investments:
Cost method:
Private equity investments $ 2,572 3,444
Federal bank stock 4,227 4,617
Total cost method 6,799 8,061
Equity method and other:
LIHTC investments (1) 4,767 4,077
Private equity and other 6,156 4,670
Total equity method and other 10,923 8,747
Total nonmarketable
equity investments (2) $ 17,722 16,808
Marketable equity securities:
Cost $ 2,337 2,929
Net unrealized gains 448 488
Total marketable
equity securities (3) $ 2,785 3,417
(1) Represents low income housing tax credit investments.
(2) Included in other assets on the balance sheet. See Note 7 (Premises, Equipment,
Lease Commitments and Other Assets) to Financial Statements in this Report for
additional information.
(3) Included in securities available for sale. See Note 5 (Securities Available for Sale)
to Financial Statements in this Report for additional information.
LIQUIDITY AND FUNDING The objective of effective liquidity
management is to ensure that we can meet customer loan
requests, customer deposit maturities/withdrawals and other
cash commitments efficiently under both normal operating
conditions and under unpredictable circumstances of industry or
market stress. To achieve this objective, the Corporate ALCO
establishes and monitors liquidity guidelines that require
sufficient asset-based liquidity to cover potential funding
requirements and to avoid over-dependence on volatile, less
reliable funding markets. We set these guidelines for both the
consolidated balance sheet and for the Parent to ensure that the
Parent is a source of strength for its regulated, deposit-taking
banking subsidiaries.
Unencumbered debt and equity securities in the securities
available-for-sale portfolio provide asset liquidity, in addition to
the immediately liquid resources of cash and due from banks
and federal funds sold, securities purchased under resale
agreements and other short-term investments. The weighted-
86