Wells Fargo 2012 Annual Report Download - page 218
Download and view the complete annual report
Please find page 218 of the 2012 Wells Fargo annual report below. You can navigate through the pages in the report by either clicking on the pages listed below, or by using the keyword search tool below to find specific information within the annual report.-
 1
1 -
2
-
3
-
4
-
5
-
6
-
7
-
8
-
9
-
10
-
11
-
12
-
13
-
14
-
15
-
16
-
17
-
18
-
19
-
20
-
21
-
22
-
23
-
24
-
25
-
26
-
27
-
28
-
29
-
30
-
31
-
32
-
33
-
34
-
35
-
36
-
37
-
38
-
39
-
40
-
41
-
42
-
43
-
44
-
45
-
46
-
47
-
48
-
49
-
50
-
51
-
52
-
53
-
54
-
55
-
56
-
57
-
58
-
59
-
60
-
61
-
62
-
63
-
64
-
65
-
66
-
67
-
68
-
69
-
70
-
71
-
72
-
73
-
74
-
75
-
76
-
77
-
78
-
79
-
80
-
81
-
82
-
83
-
84
-
85
-
86
-
87
-
88
-
89
-
90
-
91
-
92
-
93
-
94
-
95
-
96
-
97
-
98
-
99
-
100
-
101
-
102
-
103
-
104
-
105
-
106
-
107
-
108
-
109
-
110
-
111
-
112
-
113
-
114
-
115
-
116
-
117
-
118
-
119
-
120
-
121
-
122
-
123
-
124
-
125
-
126
-
127
-
128
-
129
-
130
-
131
-
132
-
133
-
134
-
135
-
136
-
137
-
138
-
139
-
140
-
141
-
142
-
143
-
144
-
145
-
146
-
147
-
148
-
149
-
150
-
151
-
152
-
153
-
154
-
155
-
156
-
157
-
158
-
159
-
160
-
161
-
162
-
163
-
164
-
165
-
166
-
167
-
168
-
169
-
170
-
171
-
172
-
173
-
174
-
175
-
176
-
177
-
178
-
179
-
180
-
181
-
182
-
183
-
184
-
185
-
186
-
187
-
188
-
189
-
190
-
191
-
192
-
193
-
194
-
195
-
196
-
197
-
198
-
199
-
200
-
201
-
202
-
203
-
204
-
205
-
206
-
207
-
 208
208 -
 209
209 -
 210
210 -
 211
211 -
 212
212 -
 213
213 -
 214
214 -
 215
215 -
 216
216 -
 217
217 -
 218
218 -
 219
219 -
 220
220 -
 221
221 -
 222
222 -
 223
223 -
 224
224 -
 225
225 -
 226
226 -
 227
227 -
 228
228 -
229
-
230
-
231
-
232
-
233
-
234
-
235
-
236
-
237
-
238
-
239
-
240
-
241
-
242
-
243
-
244
-
245
-
246
-
247
-
248
-
249
-
250
-
251
-
252
 |
 |

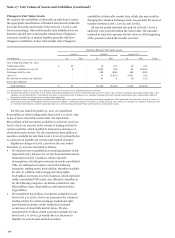
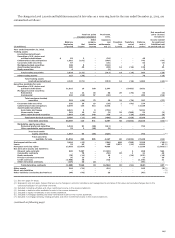
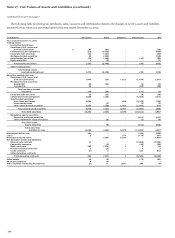
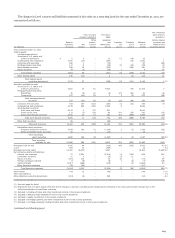
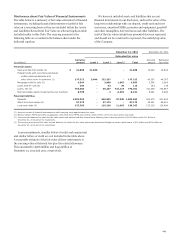
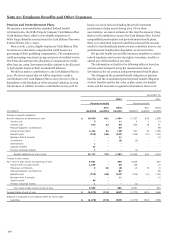
Note 17: Fair Values of Assets and Liabilities (continued)
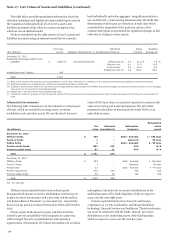
The table below provides quantitative information about the
valuation techniques and significant unobservable inputs used in
the valuation of substantially all of our Level 3 assets and
liabilities measured at fair value on a nonrecurring basis for
which we use an internal model.
We have excluded from the table classes of Level 3 assets and
liabilities measured using an internal model that we consider,
both individually and in the aggregate, insignificant relative to
our overall Level 3 nonrecurring measurements. We made this
determination based upon an evaluation of each class which
considered the magnitude of the positions, nature of the
unobservable inputs and potential for significant changes in fair
value due to changes in those inputs.
Fair Value Significant Range Weighted
($ in millions) Level 3 Valuation Technique(s) (1) Unobservable Inputs (1) of inputs Average (2)
December 31, 2012
Residential mortgages held for sale
(LOCOM) $ 1,045 (3) Discounted cash flow Default rate (4) 2.9 - 21.2 % 7.9 %
Discount rate 4.1 - 11.9 10.9
Loss severity 2.0 - 45.0 6.0
Prepayment rate (5) 1.0 - 100.0 66.7
Insignificant level 3 assets 148
Total 1,193
(1) Refer to the narrative following the recurring quantitative Level 3 table of this Note for a definition of the valuation technique(s) and significant unobservable inputs.
(2) Weighted averages are calculated using outstanding unpaid principal balance of the loans.
(3) Consists of approximately $942 million government insured/guaranteed loans purchased from GNMA-guaranteed mortgage securitization and $103 million of other mortgage
loans which are not government insured/guaranteed.
(4) Applies only to non-government insured/guaranteed loans.
(5) Includes the impact on prepayment rate of expected defaults for the government insured/guaranteed loans, which impacts the frequency and timing of early resolution of
loans.
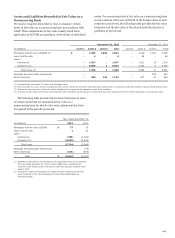
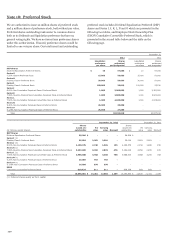
Alternative Investments
The following table summarizes our investments in various types
of funds, which are included in trading assets, securities
available for sale and other assets. We use the funds’ net asset
values (NAVs) per share as a practical expedient to measure fair
value on recurring and nonrecurring bases. The fair values
presented in the table are based upon the funds’ NAVs or an
equivalent measure.
Redemption
Fair Unfunded Redemption notice
(in millions) value commitments frequency period
December 31, 2012
Offshore funds $ 379 - Daily - Annually 1 - 180 days
Funds of funds 1 - Quarterly 90 days
Hedge funds 2 - Daily - Annually 5 - 95 days
Private equity funds 807 195 N/A N/A
Venture capital funds 82 21 N/A N/A
Total $ 1,271 216
December 31, 2011
Offshore funds $ 352 - Daily - Annually 1 - 180 days
Funds of funds 1 - Quarterly 90 days
Hedge funds 22 - Daily - Annually 5 - 95 days
Private equity funds 976 240 N/A N/A
Venture capital funds 83 28 N/A N/A
Total $ 1,434 268
N/A - Not applicable
Offshore funds primarily invest in investment grade
European fixed-income securities. Redemption restrictions are
in place for these investments with a fair value of $189 million
and $200 million at December 31, 2012 and 2011, respectively,
due to lock-up provisions that will remain in effect until October
2015.
Private equity funds invest in equity and debt securities
issued by private and publicly-held companies in connection
with leveraged buyouts, recapitalizations and expansion
opportunities. Substantially all of these investments do not allow
redemptions. Alternatively, we receive distributions as the
underlying assets of the funds liquidate, which we expect to
occur over the next eight years.
Venture capital funds invest in domestic and foreign
companies in a variety of industries, including information
technology, financial services and healthcare. These investments
can never be redeemed with the funds. Instead, we receive
distributions as the underlying assets of the fund liquidate,
which we expect to occur over the next five years.
216