Wells Fargo 2012 Annual Report Download - page 39
Download and view the complete annual report
Please find page 39 of the 2012 Wells Fargo annual report below. You can navigate through the pages in the report by either clicking on the pages listed below, or by using the keyword search tool below to find specific information within the annual report.-
 1
1 -
2
-
3
-
4
-
5
-
6
-
7
-
8
-
9
-
10
-
11
-
12
-
13
-
14
-
15
-
16
-
17
-
18
-
19
-
20
-
21
-
22
-
23
-
24
-
25
-
26
-
27
-
28
-
 29
29 -
 30
30 -
 31
31 -
 32
32 -
 33
33 -
 34
34 -
 35
35 -
 36
36 -
 37
37 -
 38
38 -
 39
39 -
 40
40 -
 41
41 -
 42
42 -
 43
43 -
 44
44 -
 45
45 -
 46
46 -
 47
47 -
 48
48 -
 49
49 -
50
-
51
-
52
-
53
-
54
-
55
-
56
-
57
-
58
-
59
-
60
-
61
-
62
-
63
-
64
-
65
-
66
-
67
-
68
-
69
-
70
-
71
-
72
-
73
-
74
-
75
-
76
-
77
-
78
-
79
-
80
-
81
-
82
-
83
-
84
-
85
-
86
-
87
-
88
-
89
-
90
-
91
-
92
-
93
-
94
-
95
-
96
-
97
-
98
-
99
-
100
-
101
-
102
-
103
-
104
-
105
-
106
-
107
-
108
-
109
-
110
-
111
-
112
-
113
-
114
-
115
-
116
-
117
-
118
-
119
-
120
-
121
-
122
-
123
-
124
-
125
-
126
-
127
-
128
-
129
-
130
-
131
-
132
-
133
-
134
-
135
-
136
-
137
-
138
-
139
-
140
-
141
-
142
-
143
-
144
-
145
-
146
-
147
-
148
-
149
-
150
-
151
-
152
-
153
-
154
-
155
-
156
-
157
-
158
-
159
-
160
-
161
-
162
-
163
-
164
-
165
-
166
-
167
-
168
-
169
-
170
-
171
-
172
-
173
-
174
-
175
-
176
-
177
-
178
-
179
-
180
-
181
-
182
-
183
-
184
-
185
-
186
-
187
-
188
-
189
-
190
-
191
-
192
-
193
-
194
-
195
-
196
-
197
-
198
-
199
-
200
-
201
-
202
-
203
-
204
-
205
-
206
-
207
-
208
-
209
-
210
-
211
-
212
-
213
-
214
-
215
-
216
-
217
-
218
-
219
-
220
-
221
-
222
-
223
-
224
-
225
-
226
-
227
-
228
-
229
-
230
-
231
-
232
-
233
-
234
-
235
-
236
-
237
-
238
-
239
-
240
-
241
-
242
-
243
-
244
-
245
-
246
-
247
-
248
-
249
-
250
-
251
-
252
 |
 |
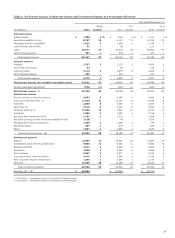
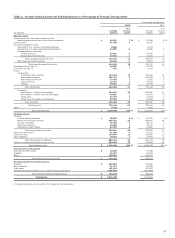
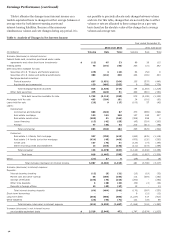
Table 4: Average Earning Assets and Funding Sources as a Percentage of Average Earning Assets
Year ended December 31,
2012 2011
% of % of
Average earning Average earning
(in millions) balance assets balance assets
Earning assets
Federal funds sold, securities purchased under
resale agreements and other short-term investments $ 84,081 7 % $ 87,186 8 %
Trading assets 41,950 4 39,737 4
Securities available for sale:
Securities of U.S. Treasur
y
and federal a
g
encies 3,604 - 5,503 -
Securities of U.S. states and political subdivisions 34,875 3 24,035 2
Mortgage-backed securities:
Federal agencies 92,887 8 74,665 7
Residential and commercial 33,545 3 31,902 3
Total mortgage-backed securities 126,432 11 106,567 10
Other debt and equity securities 49,245 4 38,625 4
Total securities available for sale 214,156 18 174,730 16
Mortgages held for sale (1) 48,955 4 37,232 3
Loans held for sale (1) 661 - 1,104 -
Loans:
Commercial:
Commercial and industrial 173,913 15 157,608 15
Real estate mortgage 105,437 9 102,236 9
Real estate construction 17,963 2 21,592 2
Lease financing 12,771 1 12,944 1
Foreign 39,852 4 36,768 3
Total commercial 349,936 31 331,148 30
Consumer:
Real estate 1-4 family first mortgage 234,619 20 226,980 21
Real estate 1-4 family junior lien mortgage 80,840 7 90,705 8
Credit card 22,772 2 21,463 2
Other revolving credit and installment 87,057 7 86,848 8
Total consumer 425,288 36 425,996 39
Total loans (1) 775,224 67 757,144 69
Other 4,438 - 4,929 -
Total earning assets $ 1,169,465 100 % $ 1,102,062 100 %
Funding sources
Deposits:
Interest-bearing checking $ 30,564 3 % $ 47,705 4 %
Market rate and other savings 505,310 43 464,450 42
Savings certificates 59,484 5 69,711 6
Other time deposits 13,363 1 13,126 1
Deposits in foreign offices 67,920 6 61,566 6
Total interest-bearing deposits 676,641 58 656,558 59
Short-term borrowings 51,196 4 51,781 5
Long-term debt 127,547 11 141,079 13
Other liabilities 10,032 1 10,955 1
Total interest-bearing liabilities 865,416 74 860,373 78
Portion of noninterest-bearing funding sources 304,049 26 241,689 22
Total funding sources $ 1,169,465 100 % $ 1,102,062 100 %
Noninterest-earning assets
Cash and due from banks $ 16,303 17,388
Goodwill 25,417 24,904
Other 130,450 125,911
Total noninterest-earning assets $ 172,170 168,203
Noninterest-bearing funding sources
Deposits $ 263,863 215,242
Other liabilities 61,214 57,399
Total equity 151,142 137,251
Noninterest-bearing funding sources used to fund earning assets (304,049) (241,689)
Net noninterest-bearing funding sources $ 172,170 168,203
Total assets $ 1,341,635 1,270,265
(1) Nonaccrual loans are included in their respective loan categories.
37