Wells Fargo 2012 Annual Report Download - page 60
Download and view the complete annual report
Please find page 60 of the 2012 Wells Fargo annual report below. You can navigate through the pages in the report by either clicking on the pages listed below, or by using the keyword search tool below to find specific information within the annual report.-
 1
1 -
2
-
3
-
4
-
5
-
6
-
7
-
8
-
9
-
10
-
11
-
12
-
13
-
14
-
15
-
16
-
17
-
18
-
19
-
20
-
21
-
22
-
23
-
24
-
25
-
26
-
27
-
28
-
29
-
30
-
31
-
32
-
33
-
34
-
35
-
36
-
37
-
38
-
39
-
40
-
41
-
42
-
43
-
44
-
45
-
46
-
47
-
48
-
49
-
 50
50 -
 51
51 -
 52
52 -
 53
53 -
 54
54 -
 55
55 -
 56
56 -
 57
57 -
 58
58 -
 59
59 -
 60
60 -
 61
61 -
 62
62 -
 63
63 -
 64
64 -
 65
65 -
 66
66 -
 67
67 -
 68
68 -
 69
69 -
 70
70 -
71
-
72
-
73
-
74
-
75
-
76
-
77
-
78
-
79
-
80
-
81
-
82
-
83
-
84
-
85
-
86
-
87
-
88
-
89
-
90
-
91
-
92
-
93
-
94
-
95
-
96
-
97
-
98
-
99
-
100
-
101
-
102
-
103
-
104
-
105
-
106
-
107
-
108
-
109
-
110
-
111
-
112
-
113
-
114
-
115
-
116
-
117
-
118
-
119
-
120
-
121
-
122
-
123
-
124
-
125
-
126
-
127
-
128
-
129
-
130
-
131
-
132
-
133
-
134
-
135
-
136
-
137
-
138
-
139
-
140
-
141
-
142
-
143
-
144
-
145
-
146
-
147
-
148
-
149
-
150
-
151
-
152
-
153
-
154
-
155
-
156
-
157
-
158
-
159
-
160
-
161
-
162
-
163
-
164
-
165
-
166
-
167
-
168
-
169
-
170
-
171
-
172
-
173
-
174
-
175
-
176
-
177
-
178
-
179
-
180
-
181
-
182
-
183
-
184
-
185
-
186
-
187
-
188
-
189
-
190
-
191
-
192
-
193
-
194
-
195
-
196
-
197
-
198
-
199
-
200
-
201
-
202
-
203
-
204
-
205
-
206
-
207
-
208
-
209
-
210
-
211
-
212
-
213
-
214
-
215
-
216
-
217
-
218
-
219
-
220
-
221
-
222
-
223
-
224
-
225
-
226
-
227
-
228
-
229
-
230
-
231
-
232
-
233
-
234
-
235
-
236
-
237
-
238
-
239
-
240
-
241
-
242
-
243
-
244
-
245
-
246
-
247
-
248
-
249
-
250
-
251
-
252
 |
 |
Risk Management – Credit Risk Management (continued)
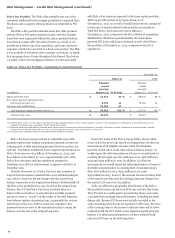
REAL ESTATE 1-4 FAMILY FIRST AND JUNIOR LIEN MORTGAGE
LOANS Our real estate 1-4 family first and junior lien mortgage
loans primarily include loans we have made to customers and
retained as part of our asset liability management strategy.
These loans also include the Pick-a-Pay portfolio acquired from
Wachovia and the home equity portfolio, which are discussed
later in this Report. In addition, these loans include other
purchased loans and loans included on our balance sheet due to
the adoption of consolidation accounting guidance related to
variable interest entities (VIEs).
Our underwriting and periodic review of loans collateralized
by residential real property includes appraisals or estimates
from automated valuation models (AVMs) to support property
values. AVMs are computer-based tools used to estimate the
market value of homes. AVMs are a lower-cost alternative to
appraisals and support valuations of large numbers of properties
in a short period of time using market comparables and price
trends for local market areas. The primary risk associated with
the use of AVMs is that the value of an individual property may
vary significantly from the average for the market area. We have
processes to periodically validate AVMs and specific risk
management guidelines addressing the circumstances when
AVMs may be used. AVMs are generally used in underwriting to
support property values on loan originations only where the loan
amount is under $250,000. We generally require property
visitation appraisals by a qualified independent appraiser for
larger residential property loans.
Some of our real estate 1-4 family first and junior lien
mortgage loans include an interest-only feature as part of the
loan terms. These interest-only loans were approximately 18% of
total loans at December 31, 2012, compared with 21% at
December 31, 2011.
We believe we have manageable adjustable-rate mortgage
(ARM) reset risk across our owned mortgage loan portfolios. We
do not offer option ARM products, nor do we offer variable-rate
mortgage products with fixed payment amounts, commonly
referred to within the financial services industry as negative
amortizing mortgage loans. Our liquidating option ARM
portfolio was acquired from Wachovia. Since our acquisition of
the Pick-a-Pay loan portfolio at the end of 2008, we have
reduced the option payment portion of the portfolio, from 86%
to 49% of the portfolio at December 31, 2012. For more
information, see the “Pick-a-Pay Portfolio” section in this
Report.
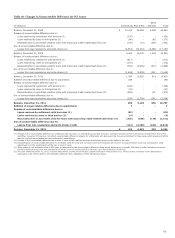
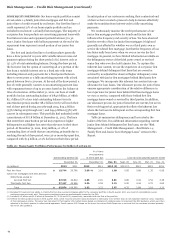
We continue to modify real estate 1-4 family mortgage loans
to assist homeowners and other borrowers in the current
difficult economic cycle. Loans are underwritten at the time of
the modification in accordance with underwriting guidelines
established for governmental and proprietary loan modification
programs. As a participant in the U.S. Treasury’s Making Home
Affordable (MHA) programs, we are focused on helping
customers stay in their homes. The MHA programs create a
standardization of modification terms including incentives paid
to borrowers, servicers, and investors. MHA includes the Home
Affordable Modification Program (HAMP) for first lien loans and
the Second Lien Modification Program (2MP) for junior lien
loans. Under both our proprietary programs and the MHA
programs, we may provide concessions such as interest rate
reductions, forbearance of principal, and in some cases,
principal forgiveness. These programs generally include trial
payment periods of three to four months, and after successful
completion and compliance with terms during this period, the
loan is permanently modified. During both the trial payment
period and/or permanent modification period, the loan is
accounted for as a TDR loan. As announced in February 2012,
we reached a settlement regarding our mortgage servicing and
foreclosure practices with the DOJ and other federal and state
government entities, which became effective on April 5, 2012,
where we committed to provide relief to borrowers with real
estate 1-4 family first and junior lien mortgage loans. Also, in
January 2013, we announced the IFR settlement under which,
we will provide foreclosure prevention actions that may include
modifications for borrowers. See the “Risk Management – Credit
Risk Management – Risks Relating to Servicing Activities”
section in this Report for more details. In addition, as
announced in October 2010, we entered into agreements with
certain state attorneys general whereby we agreed to offer loan
modifications to eligible Pick-a-Pay customers through
June 2013. These Pick-a-Pay specific agreements cover the
majority of our option payment loan portfolio and require that
we offer modifications (both HAMP and proprietary) to eligible
customers with the option payment loan product. See Note 1
(Summary of Significant Accounting Policies) to Financial
Statements in this Report for discussion on how we determine
the allowance attributable to our modified residential real estate
portfolios.
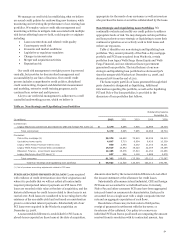
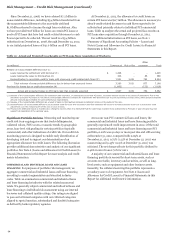
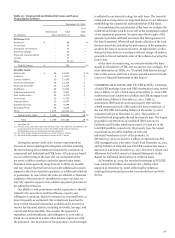
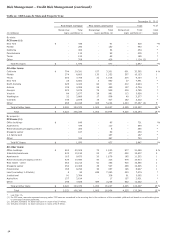
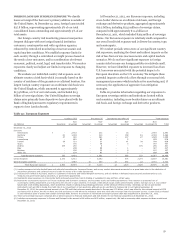
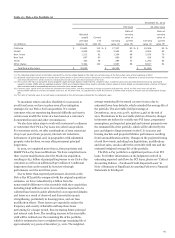
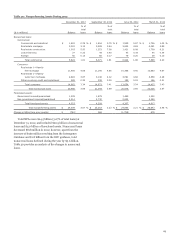
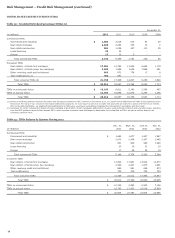
Real estate 1-4 family first and junior lien mortgage loans by
state are presented in Table 23. Our real estate 1-4 family
mortgage loans to borrowers in California represented
approximately 13% of total loans (2% of this amount were PCI
loans from Wachovia) at December 31, 2012, located mostly
within the larger metropolitan areas, with no single California
metropolitan area consisting of more than 3% of total loans. We
monitor changes in real estate values and underlying economic
or market conditions for all geographic areas of our real estate
1-4 family mortgage portfolio as part of our credit risk
management process.
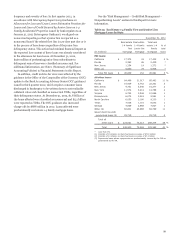
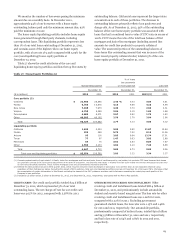
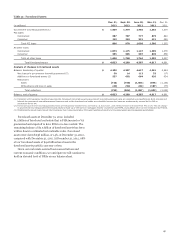
Part of our credit monitoring includes tracking delinquency,
FICO scores and collateral values (LTV/CLTV) on the entire real
estate 1-4 family mortgage loan portfolio. These credit risk
indicators, which exclude government insured/guaranteed loans,
continued to improve in 2012 on the non-PCI mortgage
portfolio. Loans 30 days or more delinquent at
December 31, 2012, totaled $15.5 billion, or 5%, of total non-PCI
mortgages, compared with $18.4 billion, or 6%, at
December 31, 2011. Loans with FICO scores lower than 640
totaled $37.7 billion at December 31, 2012, or 13% of total non-
PCI mortgages, compared with $44.1 billion, or 15%, at
December 31, 2011. Mortgages with a LTV/CLTV greater than
100% totaled $58.7 billion at December 31, 2012, or 20% of total
non-PCI mortgages, compared with $74.2 billion, or 26%, at
December 31, 2011. Information regarding credit risk indicators
can be found in Note 6 (Loans and Allowance for Credit Losses)
to Financial Statements in this Report.
We monitor the credit performance of our junior lien
mortgage portfolio for trends and factors that influence the
58