Wells Fargo 2012 Annual Report Download - page 33
Download and view the complete annual report
Please find page 33 of the 2012 Wells Fargo annual report below. You can navigate through the pages in the report by either clicking on the pages listed below, or by using the keyword search tool below to find specific information within the annual report.-
 1
1 -
2
-
3
-
4
-
5
-
6
-
7
-
8
-
9
-
10
-
11
-
12
-
13
-
14
-
15
-
16
-
17
-
18
-
19
-
20
-
21
-
22
-
 23
23 -
 24
24 -
 25
25 -
 26
26 -
 27
27 -
 28
28 -
 29
29 -
 30
30 -
 31
31 -
 32
32 -
 33
33 -
 34
34 -
 35
35 -
 36
36 -
 37
37 -
 38
38 -
 39
39 -
 40
40 -
 41
41 -
 42
42 -
 43
43 -
44
-
45
-
46
-
47
-
48
-
49
-
50
-
51
-
52
-
53
-
54
-
55
-
56
-
57
-
58
-
59
-
60
-
61
-
62
-
63
-
64
-
65
-
66
-
67
-
68
-
69
-
70
-
71
-
72
-
73
-
74
-
75
-
76
-
77
-
78
-
79
-
80
-
81
-
82
-
83
-
84
-
85
-
86
-
87
-
88
-
89
-
90
-
91
-
92
-
93
-
94
-
95
-
96
-
97
-
98
-
99
-
100
-
101
-
102
-
103
-
104
-
105
-
106
-
107
-
108
-
109
-
110
-
111
-
112
-
113
-
114
-
115
-
116
-
117
-
118
-
119
-
120
-
121
-
122
-
123
-
124
-
125
-
126
-
127
-
128
-
129
-
130
-
131
-
132
-
133
-
134
-
135
-
136
-
137
-
138
-
139
-
140
-
141
-
142
-
143
-
144
-
145
-
146
-
147
-
148
-
149
-
150
-
151
-
152
-
153
-
154
-
155
-
156
-
157
-
158
-
159
-
160
-
161
-
162
-
163
-
164
-
165
-
166
-
167
-
168
-
169
-
170
-
171
-
172
-
173
-
174
-
175
-
176
-
177
-
178
-
179
-
180
-
181
-
182
-
183
-
184
-
185
-
186
-
187
-
188
-
189
-
190
-
191
-
192
-
193
-
194
-
195
-
196
-
197
-
198
-
199
-
200
-
201
-
202
-
203
-
204
-
205
-
206
-
207
-
208
-
209
-
210
-
211
-
212
-
213
-
214
-
215
-
216
-
217
-
218
-
219
-
220
-
221
-
222
-
223
-
224
-
225
-
226
-
227
-
228
-
229
-
230
-
231
-
232
-
233
-
234
-
235
-
236
-
237
-
238
-
239
-
240
-
241
-
242
-
243
-
244
-
245
-
246
-
247
-
248
-
249
-
250
-
251
-
252
 |
 |
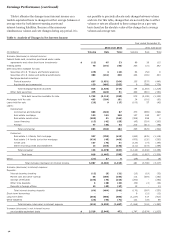
by additional revenue opportunities from mortgage banking
volume and other revenue generating activities. Because
pursuing revenue opportunities can increase expenses, we
believe our efficiency ratio, which measures our noninterest
expense as a percentage of total revenue, is an appropriate
measure of our expense management efforts. We improved our
efficiency ratio by 250 basis points to 58.5% for 2012 compared
to 61.0% for 2011. While we have made progress on improving
our efficiency, we believe our expenses are still too high and we
will continue to focus on opportunities to reduce expenses that
do not impact our ability to grow revenue. We have targeted an
efficiency ratio of 55 to 59%, and our efficiency ratio of 58.5% in
2012 was within this target range. Although our quarterly
efficiency ratio may vary due to cyclical or seasonal factors, we
believe we are well positioned to remain within our targeted
range in 2013.
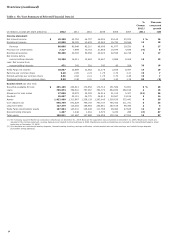
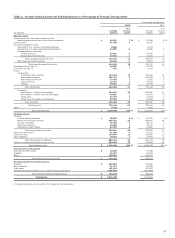
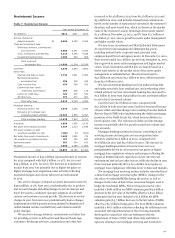
Our total assets grew 8% in 2012 to $1.4 trillion, funded
largely by strong deposit growth. Our core deposits grew
$73.1 billion ($67.2 billion on average) or 8% in 2012. The
predominant areas of asset growth were in short-term
investments, which increased $92.9 billion, and loans, which
increased $29.9 billion. Our loan growth represented core loan
growth of $47.7 billion (including retention of $19.4 billion of
1-4 family conforming first mortgage production on the balance
sheet), partially offset by the planned runoff in our non-
strategic/liquidating loan portfolio of $17.8 billion. We also
increased securities available for sale by $12.6 billion in 2012 as
rates rose and yields became more attractive.
Credit Quality
Credit quality continued to improve during 2012 as the overall
financial condition of businesses and consumers strengthened
and the housing market in many areas of the nation improved.
The improvement in our credit portfolio was also due in part to
the continued decline in balances in our non-
strategic/liquidating loan portfolios, which have declined
$96.3 billion since the beginning of 2009, and totaled
$94.6 billion at December 31, 2012.
Our reported credit metrics in 2012 improved even though
they were adversely affected by guidance issued by bank
regulators in first quarter 2012 relating to junior lien mortgages
(Interagency guidance) and guidance issued by the Office of the
Comptroller of the Currency (OCC) in third quarter 2012 relating
to loans discharged in bankruptcy (OCC guidance). The
Interagency guidance requires junior lien mortgages to be placed
on nonaccrual status if the related first lien mortgage is
nonaccruing. The OCC guidance requires consumer loans
discharged in bankruptcy to be written down to net realizable
collateral value (fair value of collateral less estimated costs to
sell) and classified as nonaccrual troubled debt restructurings
(TDRs), regardless of their delinquency status. The Interagency
guidance increased our nonperforming assets by $960 million as
of December 31, 2012. The OCC guidance increased
nonperforming assets by $1.8 billion as of December 31, 2012,
and increased loan charge-offs by $888 million for 2012.
Including the combined adverse effect of the new junior lien and
bankruptcy regulatory guidance:
x net charge-offs were $9.0 billion in 2012 (1.17% of average
loans) compared with $11.3 billion in 2011 (1.49% of average
loans);
x nonperforming assets were $24.5 billion at
December 31, 2012, down from $26.0 billion at December 31,
2011; and
x loans 90 days or more past due and still accruing (excluding
government insured/guaranteed loans) were $1.4 billion at
December 31, 2012, compared with $2.0 billion at
December 31, 2011.
Our $7.2 billion provision for credit losses in 2012, which was
$682 million less than 2011, incorporated an estimate for losses
attributable to Super Storm Sandy, which occurred during the
last week of October 2012. The provision for 2012 was
$1.8 billion lower than net loan charge-offs due to continued
strong credit performance.
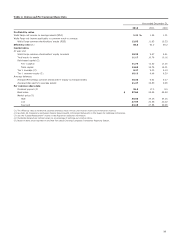
Capital
Total equity increased $17.2 billion in 2012 to $158.9 billion and
our Tier I common equity totaled $109.0 billion under Basel I, or
10.12% of risk-weighted assets. Our other capital ratios also
remained strong with a Tier 1 risk-based capital ratio of 11.75%,
total risk-based capital ratio of 14.63% and Tier 1 leverage ratio
of 9.47% at December 31, 2012, compared with 11.33%, 14.76%
and 9.03%, respectively, at December 31, 2011.
We increased our common stock dividend by 83%, and for
2012, paid dividends of $0.88 per common share and
repurchased approximately 120 million shares of common stock.
During fourth quarter 2012 we also entered into a $200 million
private forward repurchase contract to repurchase
approximately 6 million shares that is expected to settle in first
quarter 2013.
31