Wells Fargo 2012 Annual Report Download - page 151
Download and view the complete annual report
Please find page 151 of the 2012 Wells Fargo annual report below. You can navigate through the pages in the report by either clicking on the pages listed below, or by using the keyword search tool below to find specific information within the annual report.-
 1
1 -
2
-
3
-
4
-
5
-
6
-
7
-
8
-
9
-
10
-
11
-
12
-
13
-
14
-
15
-
16
-
17
-
18
-
19
-
20
-
21
-
22
-
23
-
24
-
25
-
26
-
27
-
28
-
29
-
30
-
31
-
32
-
33
-
34
-
35
-
36
-
37
-
38
-
39
-
40
-
41
-
42
-
43
-
44
-
45
-
46
-
47
-
48
-
49
-
50
-
51
-
52
-
53
-
54
-
55
-
56
-
57
-
58
-
59
-
60
-
61
-
62
-
63
-
64
-
65
-
66
-
67
-
68
-
69
-
70
-
71
-
72
-
73
-
74
-
75
-
76
-
77
-
78
-
79
-
80
-
81
-
82
-
83
-
84
-
85
-
86
-
87
-
88
-
89
-
90
-
91
-
92
-
93
-
94
-
95
-
96
-
97
-
98
-
99
-
100
-
101
-
102
-
103
-
104
-
105
-
106
-
107
-
108
-
109
-
110
-
111
-
112
-
113
-
114
-
115
-
116
-
117
-
118
-
119
-
120
-
121
-
122
-
123
-
124
-
125
-
126
-
127
-
128
-
129
-
130
-
131
-
132
-
133
-
134
-
135
-
136
-
137
-
138
-
139
-
140
-
 141
141 -
 142
142 -
 143
143 -
 144
144 -
 145
145 -
 146
146 -
 147
147 -
 148
148 -
 149
149 -
 150
150 -
 151
151 -
 152
152 -
 153
153 -
 154
154 -
 155
155 -
 156
156 -
 157
157 -
 158
158 -
 159
159 -
 160
160 -
 161
161 -
162
-
163
-
164
-
165
-
166
-
167
-
168
-
169
-
170
-
171
-
172
-
173
-
174
-
175
-
176
-
177
-
178
-
179
-
180
-
181
-
182
-
183
-
184
-
185
-
186
-
187
-
188
-
189
-
190
-
191
-
192
-
193
-
194
-
195
-
196
-
197
-
198
-
199
-
200
-
201
-
202
-
203
-
204
-
205
-
206
-
207
-
208
-
209
-
210
-
211
-
212
-
213
-
214
-
215
-
216
-
217
-
218
-
219
-
220
-
221
-
222
-
223
-
224
-
225
-
226
-
227
-
228
-
229
-
230
-
231
-
232
-
233
-
234
-
235
-
236
-
237
-
238
-
239
-
240
-
241
-
242
-
243
-
244
-
245
-
246
-
247
-
248
-
249
-
250
-
251
-
252
 |
 |
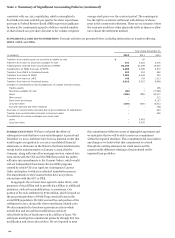
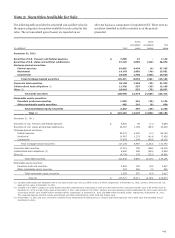
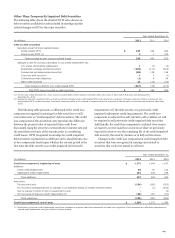
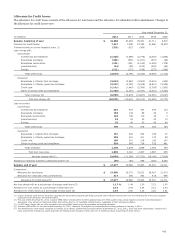
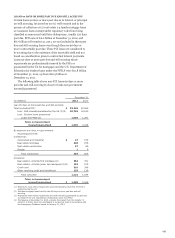
Other-Than-Temporarily Impaired Debt Securities
The following table shows the detail of OTTI write-downs on
debt securities available for sale included in earnings and the
related changes in OCI for the same securities.
Year ended December 31,
(in millions) 2012 2011 2010
OTTI on debt securities
Recorded as part of gross realized losses:
Credit-related OTTI $ 237 422 400
Intent-to-sell OTTI (1) 3 1 272
Total recorded as part of gross realized losses 240 423 672
Changes to OCI for increase (decrease) in non-credit-related OTTI (2):
U.S. states and political subdivisions 1 (1) (4)
Residential mortgage-backed securities (178) (171) (326)
Commercial mortgage-backed securities (88) 105 138
Corporate debt securities 1 2 (1)
Collateralized debt obligations (1) 4 54
Other debt securities 28 (13) (33)
Total changes to OCI for non-credit-related OTTI (237) (74) (172)
Total OTTI losses recorded on debt securities $ 3 349 500
(1) For the year ended December 31, 2010, amount includes $252 million related to securities with a fair value of $14.5 billion that were sold subsequent to
December 31, 2010.
(2) Represents amounts recorded to OCI on debt securities in periods where credit-related OTTI write-downs have occurred. Increases represent initial or subsequent non-
credit-related OTTI on debt securities. Decreases represent partial to full reversal of impairment due to recoveries in the fair value of securities due to factors other than
credit.
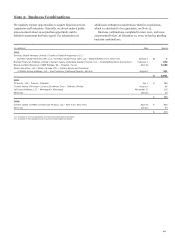
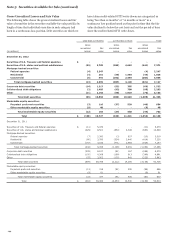
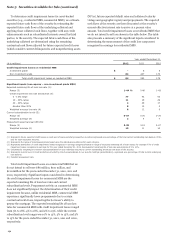
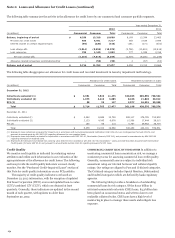
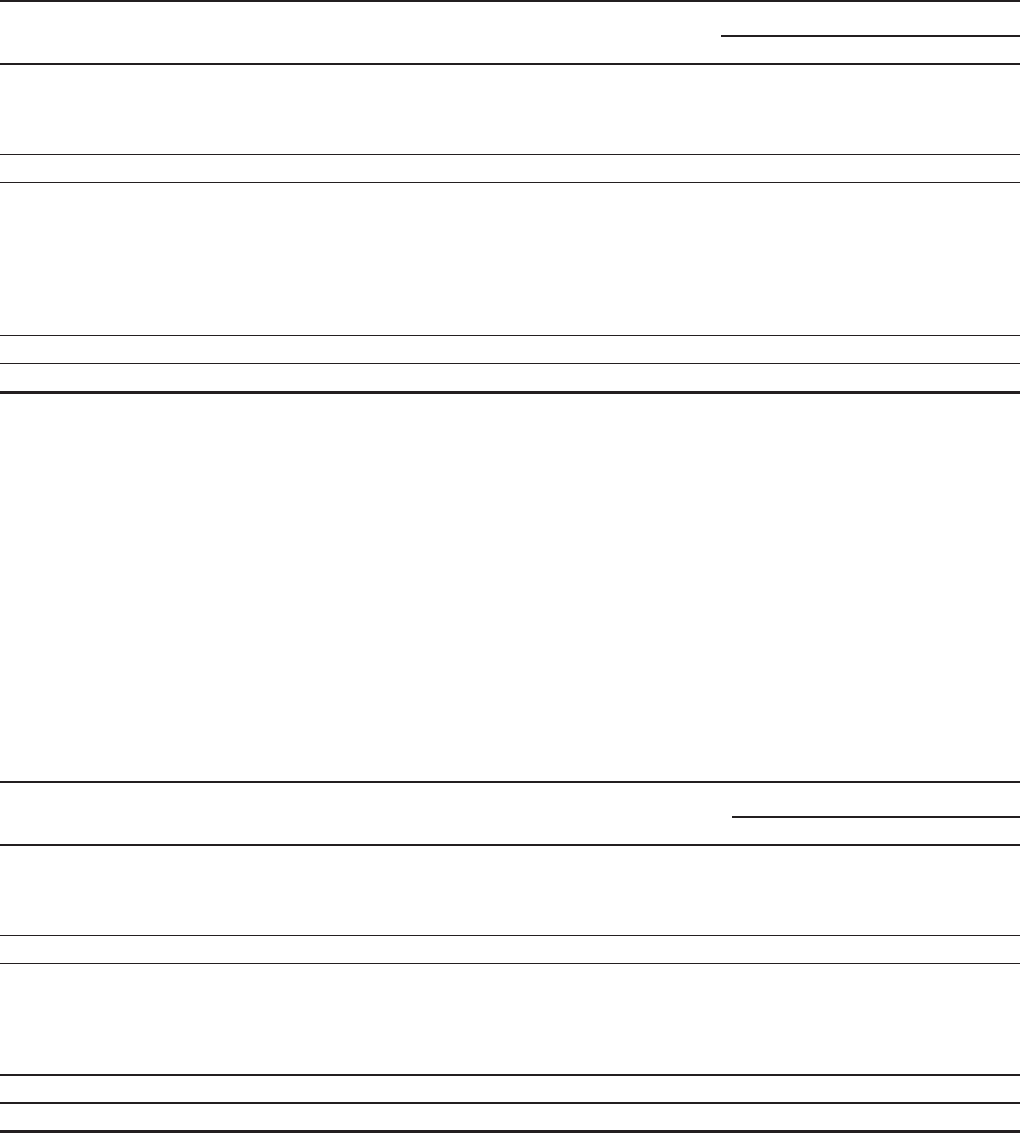
The following table presents a rollforward of the credit loss
component recognized in earnings for debt securities we still
own (referred to as “credit-impaired” debt securities). The credit
loss component of the amortized cost represents the difference
between the present value of expected future cash flows
discounted using the security’s current effective interest rate and
the amortized cost basis of the security prior to considering
credit losses. OTTI recognized in earnings for credit-impaired
debt securities is presented as additions and is classified into one
of two components based upon whether the current period is the
first time the debt security was credit-impaired (initial credit
impairment) or if the debt security was previously credit-
impaired (subsequent credit impairments). The credit loss
component is reduced if we sell, intend to sell or believe we will
be required to sell previously credit-impaired debt securities.
Additionally, the credit loss component is reduced if we receive
or expect to receive cash flows in excess of what we previously
expected to receive over the remaining life of the credit-impaired
debt security, the security matures or is fully written down.
Changes in the credit loss component of credit-impaired debt
securities that were recognized in earnings and related to
securities that we do not intend to sell were:
Year ended December 31,
(in millions) 2012 2011 2010
Credit loss component, beginning of year $ 1,272 1,043 1,187
Additions:
Initial credit impairments 55 87 122
Subsequent credit impairments 182 335 278
Total additions 237 422 400
Reductions:
For securities sold (194) (160) (263)
For securities derecognized due to changes in consolidation status of variable interest entities - (2) (242)
Due to change in intent to sell or requirement to sell - - (2)
For recoveries of previous credit impairments (1) (26) (31) (37)
Total reductions (220) (193) (544)
Credit loss component, end of year $ 1,289 1,272 1,043
(1) Recoveries of previous credit impairments result from increases in expected cash flows subsequent to credit loss recognition. Such recoveries are reflected prospectively as
interest yield adjustments using the effective interest method.
149