Wells Fargo 2012 Annual Report Download - page 240
Download and view the complete annual report
Please find page 240 of the 2012 Wells Fargo annual report below. You can navigate through the pages in the report by either clicking on the pages listed below, or by using the keyword search tool below to find specific information within the annual report.-
 1
1 -
2
-
3
-
4
-
5
-
6
-
7
-
8
-
9
-
10
-
11
-
12
-
13
-
14
-
15
-
16
-
17
-
18
-
19
-
20
-
21
-
22
-
23
-
24
-
25
-
26
-
27
-
28
-
29
-
30
-
31
-
32
-
33
-
34
-
35
-
36
-
37
-
38
-
39
-
40
-
41
-
42
-
43
-
44
-
45
-
46
-
47
-
48
-
49
-
50
-
51
-
52
-
53
-
54
-
55
-
56
-
57
-
58
-
59
-
60
-
61
-
62
-
63
-
64
-
65
-
66
-
67
-
68
-
69
-
70
-
71
-
72
-
73
-
74
-
75
-
76
-
77
-
78
-
79
-
80
-
81
-
82
-
83
-
84
-
85
-
86
-
87
-
88
-
89
-
90
-
91
-
92
-
93
-
94
-
95
-
96
-
97
-
98
-
99
-
100
-
101
-
102
-
103
-
104
-
105
-
106
-
107
-
108
-
109
-
110
-
111
-
112
-
113
-
114
-
115
-
116
-
117
-
118
-
119
-
120
-
121
-
122
-
123
-
124
-
125
-
126
-
127
-
128
-
129
-
130
-
131
-
132
-
133
-
134
-
135
-
136
-
137
-
138
-
139
-
140
-
141
-
142
-
143
-
144
-
145
-
146
-
147
-
148
-
149
-
150
-
151
-
152
-
153
-
154
-
155
-
156
-
157
-
158
-
159
-
160
-
161
-
162
-
163
-
164
-
165
-
166
-
167
-
168
-
169
-
170
-
171
-
172
-
173
-
174
-
175
-
176
-
177
-
178
-
179
-
180
-
181
-
182
-
183
-
184
-
185
-
186
-
187
-
188
-
189
-
190
-
191
-
192
-
193
-
194
-
195
-
196
-
197
-
198
-
199
-
200
-
201
-
202
-
203
-
204
-
205
-
206
-
207
-
208
-
209
-
210
-
211
-
212
-
213
-
214
-
215
-
216
-
217
-
218
-
219
-
220
-
221
-
222
-
223
-
224
-
225
-
226
-
227
-
228
-
229
-
 230
230 -
 231
231 -
 232
232 -
 233
233 -
 234
234 -
 235
235 -
 236
236 -
 237
237 -
 238
238 -
 239
239 -
 240
240 -
 241
241 -
 242
242 -
 243
243 -
 244
244 -
 245
245 -
 246
246 -
 247
247 -
 248
248 -
 249
249 -
 250
250 -
251
-
252
 |
 |

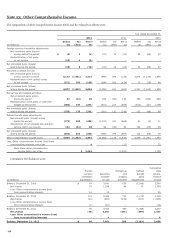
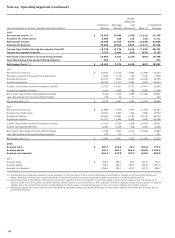
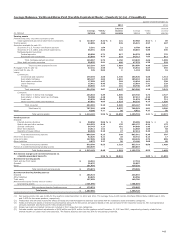
Note 24: Operating Segments (continued)
Wealth,
Brokerage
Community Wholesale and Consolidated
(income/expense in millions, average balances in billions) Banking Banking Retirement Other (1) Company
2012
Net interest income (2) $ 29,045 12,648 2,768 (1,231) 43,230
Provision for credit losses 6,835 286 125 (29) 7,217
Noninterest income 24,360 11,444 9,392 (2,340) 42,856
Noninterest expense 30,840 12,082 9,893 (2,417) 50,398
Income (loss) before income tax expense (benefit) 15,730 11,724 2,142 (1,125) 28,471
Income tax expense (benefit) 4,774 3,943 814 (428) 9,103
Net income (loss) before noncontrolling interests 10,956 7,781 1,328 (697) 19,368
Less: Net income from noncontrolling interests 464 7 - - 471
Net income (loss) (3) $ 10,492 7,774 1,328 (697) 18,897
2011
Net interest income (2) $ 29,657 11,616 2,844 (1,354) 42,763
Provision (reversal of provision) for credit losses 7,976 (110) 170 (137) 7,899
Noninterest income 21,124 9,952 9,333 (2,224) 38,185
Noninterest expense 29,252 11,177 9,934 (970) 49,393
Income (loss) before income tax expense (benefit) 13,553 10,501 2,073 (2,471) 23,656
Income tax expense (benefit) 4,104 3,495 785 (939) 7,445
Net income (loss) before noncontrolling interests 9,449 7,006 1,288 (1,532) 16,211
Less: Net income from noncontrolling interests 316 19 7 - 342
Net income (loss) (3) $ 9,133 6,987 1,281 (1,532) 15,869
2010
Net interest income (2) $ 31,885 11,474 2,707 (1,309) 44,757
Provision for credit losses 13,807 1,920 334 (308) 15,753
Noninterest income 22,604 10,951 9,023 (2,125) 40,453
Noninterest expense 30,071 11,269 9,768 (652) 50,456
Income (loss) before income tax expense (benefit) 10,611 9,236 1,628 (2,474) 19,001
Income tax expense (benefit) 3,347 3,315 616 (940) 6,338
Net income (loss) before noncontrolling interests 7,264 5,921 1,012 (1,534) 12,663
Less: Net income from noncontrolling interests 274 20 7 - 301
Net income (loss) (3) $ 6,990 5,901 1,005 (1,534) 12,362
2012
Average loans $ 487.1 273.8 42.7 (28.4) 775.2
Average assets 761.1 481.7 164.6 (65.8) 1,341.6
Average core deposits 591.2 227.0 137.5 (61.8) 893.9
2011
Average loans $ 496.3 249.1 43.0 (31.3) 757.1
Average assets 752.3 428.1 155.2 (65.3) 1,270.3
Average core deposits 556.3 202.1 130.0 (61.7) 826.7
(1) Includes Wachovia integration expenses, through completion in the first quarter of 2012, and the elimination of items that are included in both Community Banking and
Wealth, Brokerage and Retirement, largely representing services and products for wealth management customers provided in Community Banking stores.
(2) Net interest income is the difference between interest earned on assets and the cost of liabilities to fund those assets. Interest earned includes actual interest earned on
segment assets and, if the segment has excess liabilities, interest credits for providing funding to other segments. The cost of liabilities includes interest expense on segment
liabilities and, if the segment does not have enough liabilities to fund its assets, a funding charge based on the cost of excess liabilities from another segment.
(3) Represents segment net income (loss) for Community Banking; Wholesale Banking; and Wealth, Brokerage and Retirement segments and Wells Fargo net income for the
consolidated company.
238